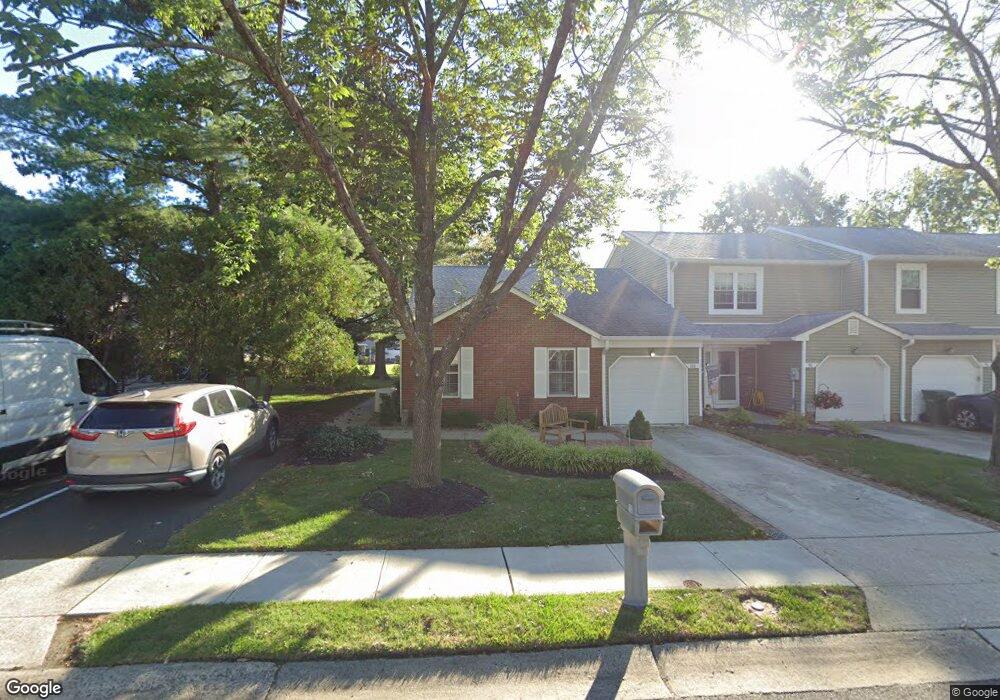
100 Oak Ln Eatontown, NJ 07724
Estimated Value: $524,000 - $567,000
2
Beds
2
Baths
1,296
Sq Ft
$416/Sq Ft
Est. Value
About This Home
This home is located at 100 Oak Ln, Eatontown, NJ 07724 and is currently estimated at $539,273, approximately $416 per square foot. 100 Oak Ln is a home located in Monmouth County with nearby schools including Margaret L. Vetter Elementary School, Memorial Middle School, and Ranney School.
Ownership History
Date
Name
Owned For
Owner Type
Purchase Details
Closed on
Jun 16, 2017
Sold by
Orr Holly
Bought by
Brown Sharon M
Current Estimated Value
Home Financials for this Owner
Home Financials are based on the most recent Mortgage that was taken out on this home.
Original Mortgage
$228,000
Outstanding Balance
$189,648
Interest Rate
4.02%
Mortgage Type
New Conventional
Estimated Equity
$349,625
Purchase Details
Closed on
Apr 9, 2004
Sold by
Haring Robert
Bought by
Orr Holly
Create a Home Valuation Report for This Property
The Home Valuation Report is an in-depth analysis detailing your home's value as well as a comparison with similar homes in the area
Home Values in the Area
Average Home Value in this Area
Purchase History
| Date | Buyer | Sale Price | Title Company |
|---|---|---|---|
| Brown Sharon M | $310,000 | Trident Abstract Title | |
| Orr Holly | $268,000 | -- |
Source: Public Records
Mortgage History
| Date | Status | Borrower | Loan Amount |
|---|---|---|---|
| Open | Brown Sharon M | $228,000 |
Source: Public Records
Tax History Compared to Growth
Tax History
| Year | Tax Paid | Tax Assessment Tax Assessment Total Assessment is a certain percentage of the fair market value that is determined by local assessors to be the total taxable value of land and additions on the property. | Land | Improvement |
|---|---|---|---|---|
| 2025 | $8,134 | $496,400 | $325,600 | $170,800 |
| 2024 | $8,284 | $434,500 | $273,300 | $161,200 |
| 2023 | $8,284 | $420,300 | $273,300 | $147,000 |
| 2022 | $7,238 | $401,800 | $273,300 | $128,500 |
| 2021 | $7,238 | $314,700 | $190,500 | $124,200 |
| 2020 | $6,977 | $306,000 | $185,500 | $120,500 |
| 2019 | $6,544 | $287,400 | $170,500 | $116,900 |
| 2018 | $6,489 | $280,800 | $170,500 | $110,300 |
| 2017 | $6,031 | $270,100 | $160,500 | $109,600 |
| 2016 | $5,693 | $260,800 | $150,500 | $110,300 |
| 2015 | $5,778 | $259,900 | $145,500 | $114,400 |
| 2014 | $5,008 | $222,000 | $120,500 | $101,500 |
Source: Public Records
Map
Nearby Homes