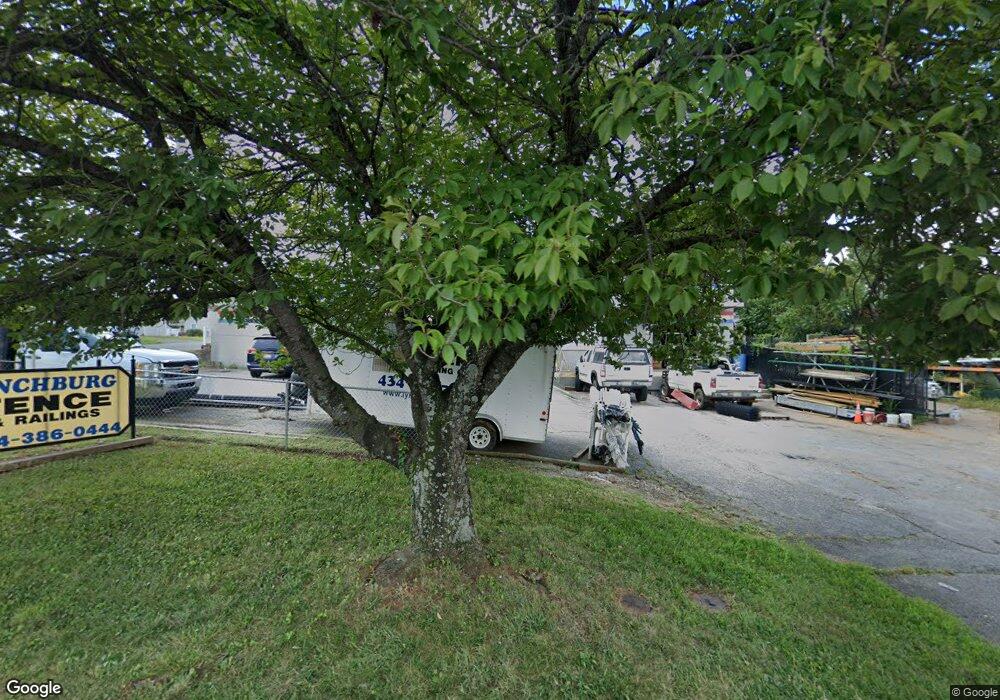
100 Oakley Ave Lynchburg, VA 24501
Westend NeighborhoodEstimated Value: $298,841
--
Bed
--
Bath
6,000
Sq Ft
$50/Sq Ft
Est. Value
About This Home
This home is located at 100 Oakley Ave, Lynchburg, VA 24501 and is currently estimated at $298,841, approximately $49 per square foot. 100 Oakley Ave is a home located in Lynchburg City with nearby schools including Perrymont Elementary School, Paul Laurence Dunbar Mid. for Innov., and E.C. Glass High School.
Ownership History
Date
Name
Owned For
Owner Type
Purchase Details
Closed on
Nov 4, 2013
Sold by
Web Investment Inc
Bought by
Lynchburg Fence & Railing Co Llc
Current Estimated Value
Home Financials for this Owner
Home Financials are based on the most recent Mortgage that was taken out on this home.
Original Mortgage
$22,500
Interest Rate
7%
Mortgage Type
Commercial
Create a Home Valuation Report for This Property
The Home Valuation Report is an in-depth analysis detailing your home's value as well as a comparison with similar homes in the area
Home Values in the Area
Average Home Value in this Area
Purchase History
| Date | Buyer | Sale Price | Title Company |
|---|---|---|---|
| Lynchburg Fence & Railing Co Llc | $150,000 | Old Republic Natl Title Ins |
Source: Public Records
Mortgage History
| Date | Status | Borrower | Loan Amount |
|---|---|---|---|
| Closed | Lynchburg Fence & Railing Co Llc | $22,500 | |
| Open | Lynchburg Fence & Railing Co Llc | $127,500 |
Source: Public Records
Tax History Compared to Growth
Tax History
| Year | Tax Paid | Tax Assessment Tax Assessment Total Assessment is a certain percentage of the fair market value that is determined by local assessors to be the total taxable value of land and additions on the property. | Land | Improvement |
|---|---|---|---|---|
| 2025 | $2,310 | $275,000 | $100,000 | $175,000 |
| 2024 | $2,132 | $239,500 | $98,100 | $141,400 |
| 2023 | $2,132 | $239,500 | $98,100 | $141,400 |
| 2022 | $1,943 | $188,600 | $98,100 | $90,500 |
| 2021 | $2,093 | $188,600 | $98,100 | $90,500 |
| 2020 | $1,939 | $174,700 | $98,100 | $76,600 |
| 2019 | $1,939 | $174,700 | $98,100 | $76,600 |
| 2018 | $1,864 | $167,900 | $82,000 | $85,900 |
| 2017 | $1,864 | $167,900 | $82,000 | $85,900 |
| 2016 | $1,864 | $167,900 | $82,000 | $85,900 |
| 2015 | $1,864 | $167,900 | $82,000 | $85,900 |
| 2014 | $1,864 | $167,900 | $82,000 | $85,900 |
Source: Public Records
Map
Nearby Homes
- 410 Hood St
- 408 Hood St
- 609 Hood St
- 721 Rockbridge Ave
- 235 Bell St
- 245 Bell St
- 301 Bell St
- 311 Bell St
- 490 Oakley Ave
- 101 Thomas Rd
- 201 Thomas Rd
- 404 Newberne St
- 2612 Norma St
- 3508 Joel St
- 2134 Westerly Dr
- 423 Westover Blvd
- 1810 Broadway St Unit 216
- 1810 Broadway St Unit 208
- 1810 Broadway St Unit 211
- 3008 Hill St Unit 400