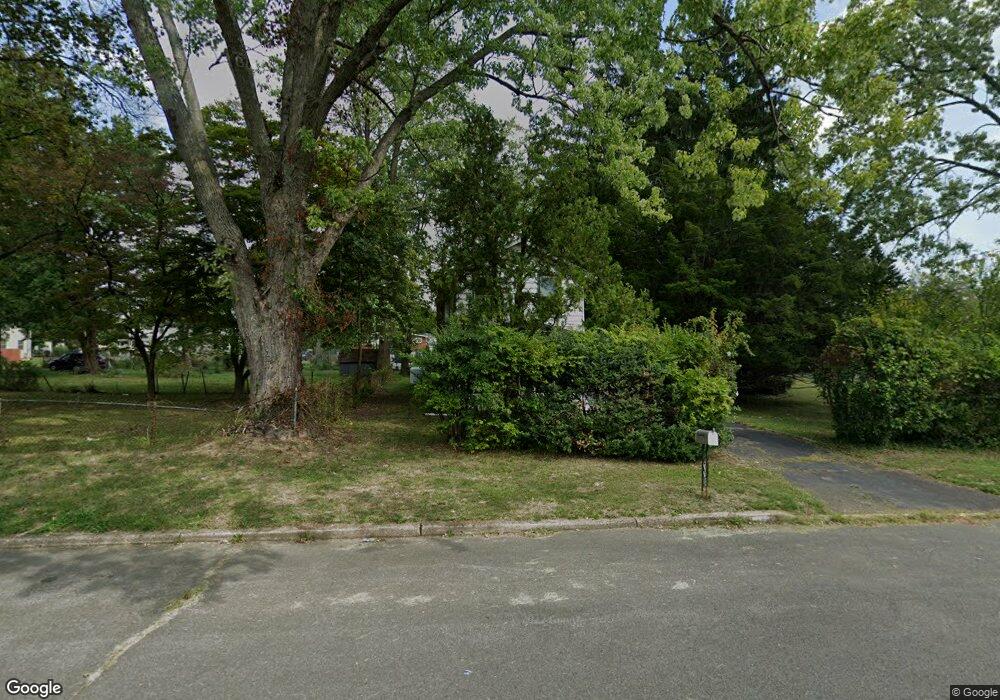
100 Oregon Ave Ewing, NJ 08638
Braeburn Heights NeighborhoodEstimated Value: $227,000 - $342,000
--
Bed
--
Bath
1,216
Sq Ft
$239/Sq Ft
Est. Value
About This Home
This home is located at 100 Oregon Ave, Ewing, NJ 08638 and is currently estimated at $290,399, approximately $238 per square foot. 100 Oregon Ave is a home located in Mercer County with nearby schools including Ewing High School, Paul Robeson Charter School For The Humanities, and Trenton Stem-To-Civics Charter School.
Ownership History
Date
Name
Owned For
Owner Type
Purchase Details
Closed on
Sep 18, 2025
Sold by
Impactful Equity Ventures Llc
Bought by
Impactful Equity Ventures Llc
Current Estimated Value
Purchase Details
Closed on
Feb 9, 2024
Sold by
Kemler John A
Bought by
Impactful Equity Ventures Llc and Tucker
Purchase Details
Closed on
Oct 28, 2010
Sold by
Tucker Joseph and Tucker Van Bertha
Bought by
Vanputten Corey and Tucker Joseph
Home Financials for this Owner
Home Financials are based on the most recent Mortgage that was taken out on this home.
Interest Rate
4.23%
Purchase Details
Closed on
Sep 25, 1995
Sold by
Poindexter Mary L
Bought by
Tucker Joseph and Van Putten Bertha
Create a Home Valuation Report for This Property
The Home Valuation Report is an in-depth analysis detailing your home's value as well as a comparison with similar homes in the area
Home Values in the Area
Average Home Value in this Area
Purchase History
| Date | Buyer | Sale Price | Title Company |
|---|---|---|---|
| Impactful Equity Ventures Llc | -- | Leeper Land Group | |
| Impactful Equity Ventures Llc | $78,314 | None Listed On Document | |
| Impactful Equity Ventures Llc | $78,314 | None Listed On Document | |
| Vanputten Corey | -- | -- | |
| Tucker Joseph | $26,533 | -- |
Source: Public Records
Mortgage History
| Date | Status | Borrower | Loan Amount |
|---|---|---|---|
| Previous Owner | Vanputten Corey | -- |
Source: Public Records
Tax History Compared to Growth
Tax History
| Year | Tax Paid | Tax Assessment Tax Assessment Total Assessment is a certain percentage of the fair market value that is determined by local assessors to be the total taxable value of land and additions on the property. | Land | Improvement |
|---|---|---|---|---|
| 2025 | $5,837 | $148,400 | $55,400 | $93,000 |
| 2024 | $5,486 | $148,400 | $55,400 | $93,000 |
| 2023 | $5,486 | $148,400 | $55,400 | $93,000 |
| 2022 | $5,338 | $148,400 | $55,400 | $93,000 |
| 2021 | $5,207 | $148,400 | $55,400 | $93,000 |
| 2020 | $4,633 | $148,400 | $55,400 | $93,000 |
| 2019 | $5,000 | $148,400 | $55,400 | $93,000 |
| 2018 | $5,039 | $95,400 | $45,000 | $50,400 |
| 2017 | $5,156 | $95,400 | $45,000 | $50,400 |
| 2016 | $5,087 | $95,400 | $45,000 | $50,400 |
| 2015 | $4,519 | $95,400 | $45,000 | $50,400 |
| 2014 | $4,506 | $95,400 | $45,000 | $50,400 |
Source: Public Records
Map
Nearby Homes
- 121 Oregon Ave
- 111 Louisiana Ave
- 120 Sussex St
- 28 Brattle Ave
- 194 Woodland Ave
- 117 Browning Ave
- 140 Crescent Ave
- 186 Upland Ave
- 188 Browning Ave
- 200 Upland Ave
- 200 Claflin Ave
- 107 Hawthorne Ave
- 137 Ardsley Ave
- 50 Groveland Ave
- 1583 Pennington Rd
- 14 Chesney Ave
- 9 Auburn Ave
- 91 Groveland Ave
- 991 Terrace Blvd
- 50 Hillman Ave