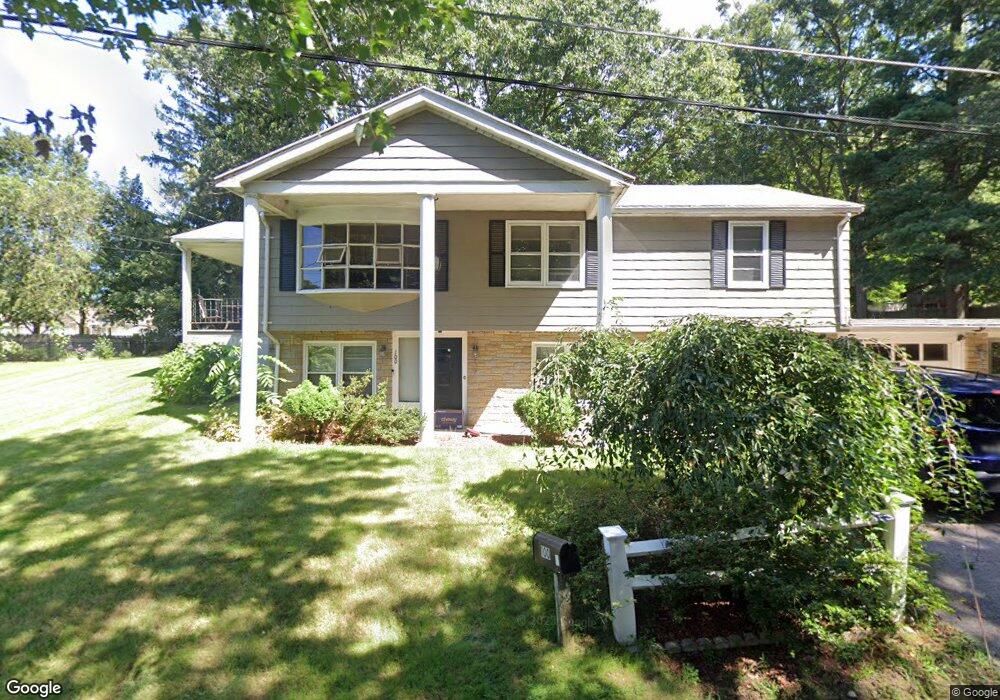
100 Oswego St Bellingham, MA 02019
Estimated Value: $472,000 - $503,000
3
Beds
1
Bath
1,408
Sq Ft
$345/Sq Ft
Est. Value
About This Home
This home is located at 100 Oswego St, Bellingham, MA 02019 and is currently estimated at $486,414, approximately $345 per square foot. 100 Oswego St is a home located in Norfolk County with nearby schools including Joseph F. DiPietro Elementary, Bellingham High School, and Rise Prep Mayoral Academy Middle School.
Ownership History
Date
Name
Owned For
Owner Type
Purchase Details
Closed on
Nov 21, 2008
Sold by
Wigmore Yvonne M
Bought by
Souza Robert P
Current Estimated Value
Home Financials for this Owner
Home Financials are based on the most recent Mortgage that was taken out on this home.
Original Mortgage
$243,589
Interest Rate
6.03%
Mortgage Type
Purchase Money Mortgage
Purchase Details
Closed on
Jul 1, 2008
Sold by
Truchan Michael
Bought by
Wigmore Yvonne M
Purchase Details
Closed on
Apr 27, 2007
Sold by
Mancini Michael
Bought by
Truchan Michael and Wigmore Yvonne M
Create a Home Valuation Report for This Property
The Home Valuation Report is an in-depth analysis detailing your home's value as well as a comparison with similar homes in the area
Home Values in the Area
Average Home Value in this Area
Purchase History
| Date | Buyer | Sale Price | Title Company |
|---|---|---|---|
| Souza Robert P | $252,000 | -- | |
| Wigmore Yvonne M | -- | -- | |
| Truchan Michael | $170,000 | -- | |
| Mancini Michael | -- | -- | |
| Souza Robert P | $252,000 | -- | |
| Wigmore Yvonne M | -- | -- | |
| Truchan Michael | $170,000 | -- |
Source: Public Records
Mortgage History
| Date | Status | Borrower | Loan Amount |
|---|---|---|---|
| Open | Truchan Michael | $247,152 | |
| Closed | Souza Robert P | $243,589 |
Source: Public Records
Tax History Compared to Growth
Tax History
| Year | Tax Paid | Tax Assessment Tax Assessment Total Assessment is a certain percentage of the fair market value that is determined by local assessors to be the total taxable value of land and additions on the property. | Land | Improvement |
|---|---|---|---|---|
| 2025 | $5,030 | $400,500 | $165,900 | $234,600 |
| 2024 | $4,835 | $376,000 | $151,400 | $224,600 |
| 2023 | $4,661 | $357,200 | $144,200 | $213,000 |
| 2022 | $4,549 | $323,100 | $120,300 | $202,800 |
| 2021 | $4,411 | $306,100 | $120,300 | $185,800 |
| 2020 | $4,178 | $293,800 | $120,300 | $173,500 |
| 2019 | $4,098 | $288,400 | $120,300 | $168,100 |
| 2018 | $3,823 | $265,300 | $115,600 | $149,700 |
| 2017 | $3,736 | $260,500 | $115,600 | $144,900 |
| 2016 | $3,593 | $251,400 | $113,700 | $137,700 |
| 2015 | $3,444 | $241,700 | $109,300 | $132,400 |
| 2014 | $3,463 | $236,200 | $106,800 | $129,400 |
Source: Public Records
Map
Nearby Homes