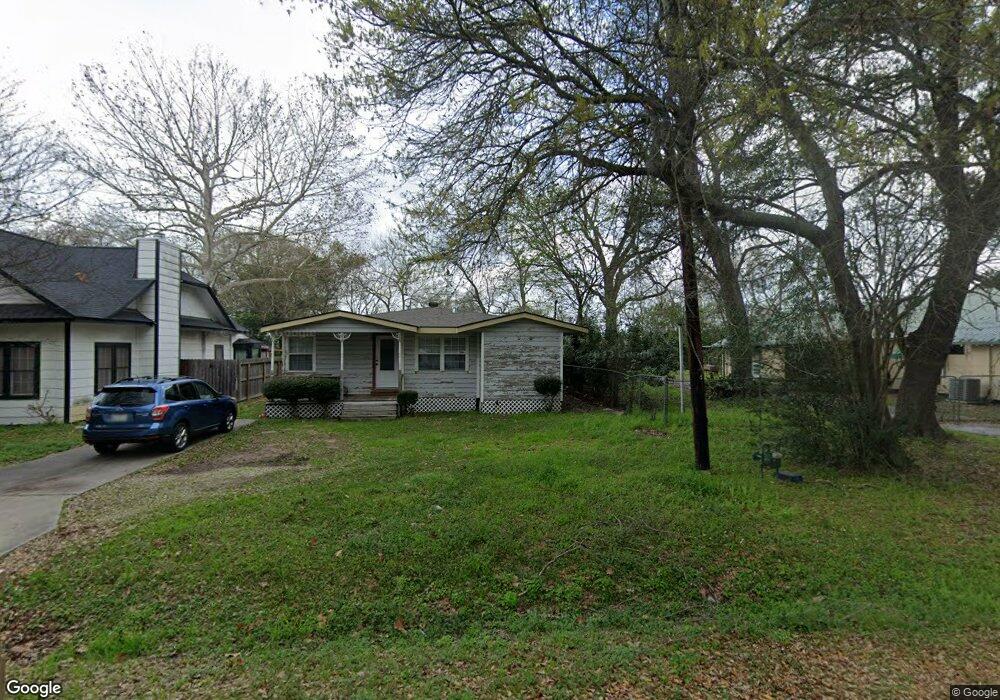
100 Oxford St Tomball, TX 77375
Estimated Value: $180,366 - $247,000
2
Beds
1
Bath
1,032
Sq Ft
$216/Sq Ft
Est. Value
About This Home
This home is located at 100 Oxford St, Tomball, TX 77375 and is currently estimated at $222,592, approximately $215 per square foot. 100 Oxford St is a home located in Harris County with nearby schools including Tomball Elementary School, Tomball Intermediate School, and Tomball Junior High School.
Ownership History
Date
Name
Owned For
Owner Type
Purchase Details
Closed on
Aug 1, 2009
Sold by
Rachac Frank A
Bought by
Loera Alejandro O and Loera Yolanda M
Current Estimated Value
Home Financials for this Owner
Home Financials are based on the most recent Mortgage that was taken out on this home.
Original Mortgage
$66,500
Interest Rate
5.44%
Mortgage Type
Seller Take Back
Purchase Details
Closed on
Sep 15, 2000
Sold by
Thompson Eric and Thompson Mandy E
Bought by
Rachac Frank A and Rachac Virginia S
Purchase Details
Closed on
Feb 28, 1997
Sold by
Greenridge Properties
Bought by
Thompson Eric
Home Financials for this Owner
Home Financials are based on the most recent Mortgage that was taken out on this home.
Original Mortgage
$52,250
Interest Rate
7.92%
Create a Home Valuation Report for This Property
The Home Valuation Report is an in-depth analysis detailing your home's value as well as a comparison with similar homes in the area
Home Values in the Area
Average Home Value in this Area
Purchase History
| Date | Buyer | Sale Price | Title Company |
|---|---|---|---|
| Loera Alejandro O | -- | None Available | |
| Rachac Frank A | -- | Alamo Title Company | |
| Thompson Eric | -- | Stewart Title |
Source: Public Records
Mortgage History
| Date | Status | Borrower | Loan Amount |
|---|---|---|---|
| Closed | Loera Alejandro O | $66,500 | |
| Previous Owner | Thompson Eric | $52,250 |
Source: Public Records
Tax History Compared to Growth
Tax History
| Year | Tax Paid | Tax Assessment Tax Assessment Total Assessment is a certain percentage of the fair market value that is determined by local assessors to be the total taxable value of land and additions on the property. | Land | Improvement |
|---|---|---|---|---|
| 2025 | $129 | $172,313 | $105,000 | $67,313 |
| 2024 | $129 | $165,313 | $98,000 | $67,313 |
| 2023 | $129 | $151,313 | $84,000 | $67,313 |
| 2022 | $2,064 | $120,229 | $63,000 | $57,229 |
| 2021 | $1,974 | $90,482 | $45,500 | $44,982 |
| 2020 | $1,856 | $82,684 | $35,000 | $47,684 |
| 2019 | $1,735 | $68,783 | $28,000 | $40,783 |
| 2018 | $636 | $72,478 | $28,000 | $44,478 |
| 2017 | $1,850 | $73,921 | $28,000 | $45,921 |
| 2016 | $1,682 | $69,839 | $28,000 | $41,839 |
| 2015 | $1,124 | $70,276 | $28,000 | $42,276 |
| 2014 | $1,124 | $55,157 | $28,000 | $27,157 |
Source: Public Records
Map
Nearby Homes
- 0 N Sycamore St
- 20734 Open Range Ct
- 18818 Cornelia Fields Ln
- 18723 Buttercup Farms Ln
- 20718 Open Range Ct
- 19951 Epona Creek Dr
- 19935 Epona Creek Dr
- 18707 Buttercup Farms Ln
- 18826 Cornelia Fields Ln
- 20714 Open Range Ct
- Lot 46 Moore St
- Lot 45 Moore St
- 306 E Main St
- 650 Texas St
- 315 Mechanic St
- lt 19 Mechanic Rd
- 532 Carrell St
- TBD Mechanic St
- 504 Percival St Unit A
- 0 Mechanic Unit 5403633