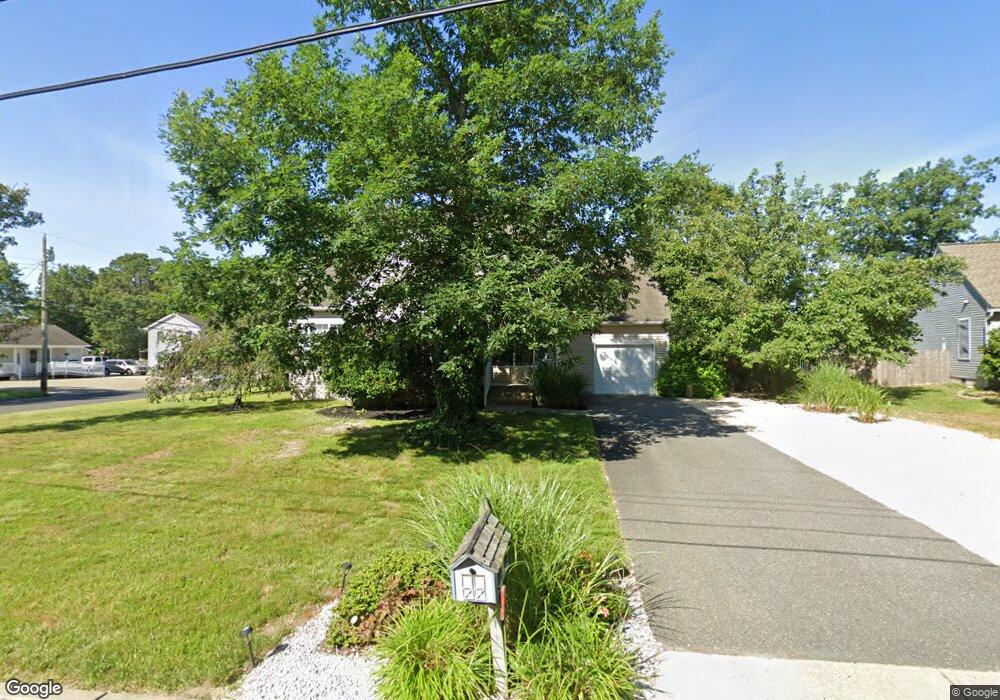
100 Quadrant Rd Manahawkin, NJ 08050
Stafford NeighborhoodEstimated Value: $496,000 - $589,000
4
Beds
2
Baths
3,040
Sq Ft
$180/Sq Ft
Est. Value
About This Home
This home is located at 100 Quadrant Rd, Manahawkin, NJ 08050 and is currently estimated at $547,941, approximately $180 per square foot. 100 Quadrant Rd is a home located in Ocean County with nearby schools including Ocean Acres Elementary School, Oxycocus Elementary School, and McKinley Avenue Elementary School.
Ownership History
Date
Name
Owned For
Owner Type
Purchase Details
Closed on
Jun 20, 2003
Sold by
Lighthouse Development Co Inc
Bought by
Uberti Harry A and Uberti Eileen M
Current Estimated Value
Home Financials for this Owner
Home Financials are based on the most recent Mortgage that was taken out on this home.
Original Mortgage
$195,000
Outstanding Balance
$83,433
Interest Rate
5.46%
Estimated Equity
$464,508
Create a Home Valuation Report for This Property
The Home Valuation Report is an in-depth analysis detailing your home's value as well as a comparison with similar homes in the area
Home Values in the Area
Average Home Value in this Area
Purchase History
| Date | Buyer | Sale Price | Title Company |
|---|---|---|---|
| Uberti Harry A | $225,000 | -- |
Source: Public Records
Mortgage History
| Date | Status | Borrower | Loan Amount |
|---|---|---|---|
| Open | Uberti Harry A | $195,000 |
Source: Public Records
Tax History Compared to Growth
Tax History
| Year | Tax Paid | Tax Assessment Tax Assessment Total Assessment is a certain percentage of the fair market value that is determined by local assessors to be the total taxable value of land and additions on the property. | Land | Improvement |
|---|---|---|---|---|
| 2025 | $6,918 | $278,600 | $68,100 | $210,500 |
| 2024 | $6,851 | $278,600 | $68,100 | $210,500 |
| 2023 | $6,558 | $278,600 | $68,100 | $210,500 |
| 2022 | $6,558 | $278,600 | $68,100 | $210,500 |
| 2021 | $6,469 | $278,600 | $68,100 | $210,500 |
| 2020 | $6,477 | $278,600 | $68,100 | $210,500 |
| 2019 | $6,386 | $278,600 | $68,100 | $210,500 |
| 2018 | $6,347 | $278,600 | $68,100 | $210,500 |
| 2017 | $6,400 | $272,000 | $68,100 | $203,900 |
| 2016 | $6,335 | $272,000 | $68,100 | $203,900 |
| 2015 | $6,112 | $272,000 | $68,100 | $203,900 |
| 2014 | $5,997 | $263,600 | $67,300 | $196,300 |
Source: Public Records
Map
Nearby Homes
- 117 Topside Rd
- 225 Yeoman Rd
- 246 Atlantis Ave
- 182 Atlantis Ave
- 309 Neptune Dr
- 100 Leeward Rd
- 296 Neptune Dr
- 181 Bowline Rd
- 101 Topsail Ln
- 248 Mizzen Ave
- 139 Mermaid Dr
- 137 Skipper Rd
- 223 Serpent Ln
- 1186 Galley Ave
- 220 Middie Ln
- 113 Toggle Rd
- 217 Middie Ln
- 1034 Buccaneer Ln
- 169 Stowaway Rd
- 296 Nautilus Dr