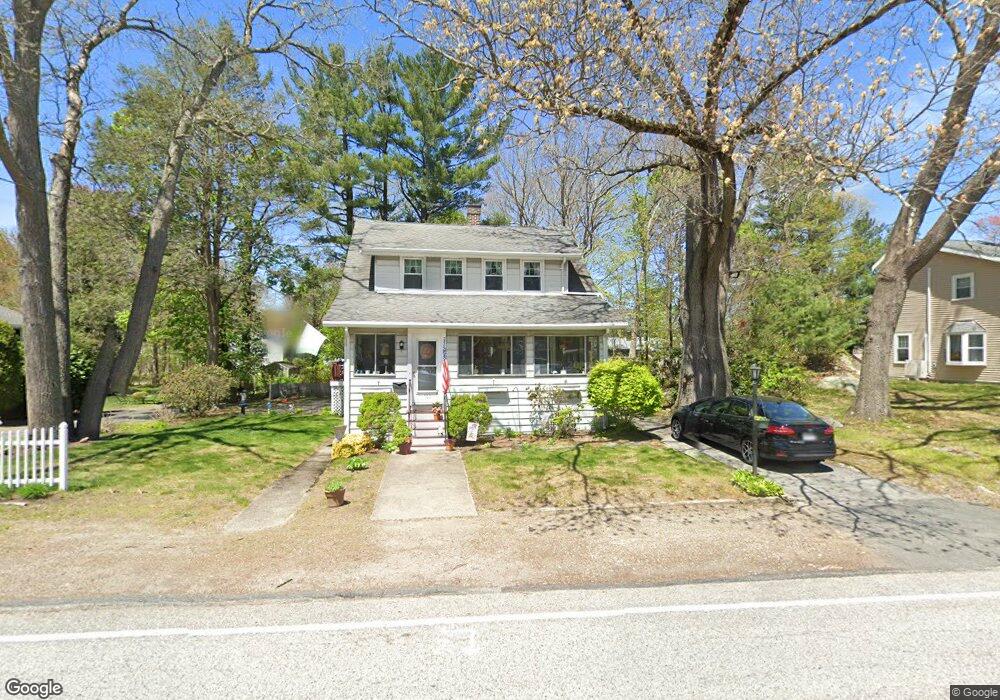
100 Ralph Talbot St South Weymouth, MA 02190
South Weymouth NeighborhoodEstimated Value: $624,262 - $977,000
3
Beds
2
Baths
1,652
Sq Ft
$437/Sq Ft
Est. Value
About This Home
This home is located at 100 Ralph Talbot St, South Weymouth, MA 02190 and is currently estimated at $721,816, approximately $436 per square foot. 100 Ralph Talbot St is a home located in Norfolk County with nearby schools including Ralph Talbot Primary School, Abigail Adams Middle School, and Weymouth Middle School Chapman.
Ownership History
Date
Name
Owned For
Owner Type
Purchase Details
Closed on
Jun 28, 1995
Sold by
Macintyre Daniel L and Macintyre Patricia
Bought by
Macintyre Patricia
Current Estimated Value
Home Financials for this Owner
Home Financials are based on the most recent Mortgage that was taken out on this home.
Original Mortgage
$65,000
Interest Rate
7.8%
Mortgage Type
Purchase Money Mortgage
Create a Home Valuation Report for This Property
The Home Valuation Report is an in-depth analysis detailing your home's value as well as a comparison with similar homes in the area
Home Values in the Area
Average Home Value in this Area
Purchase History
| Date | Buyer | Sale Price | Title Company |
|---|---|---|---|
| Macintyre Patricia | $80,000 | -- |
Source: Public Records
Mortgage History
| Date | Status | Borrower | Loan Amount |
|---|---|---|---|
| Closed | Macintyre Patricia | $65,000 | |
| Closed | Macintyre Patricia | $10,000 |
Source: Public Records
Tax History Compared to Growth
Tax History
| Year | Tax Paid | Tax Assessment Tax Assessment Total Assessment is a certain percentage of the fair market value that is determined by local assessors to be the total taxable value of land and additions on the property. | Land | Improvement |
|---|---|---|---|---|
| 2025 | $5,047 | $499,700 | $214,800 | $284,900 |
| 2024 | $4,789 | $466,300 | $204,600 | $261,700 |
| 2023 | $4,612 | $441,300 | $189,400 | $251,900 |
| 2022 | $4,501 | $392,800 | $175,400 | $217,400 |
| 2021 | $4,150 | $353,500 | $175,400 | $178,100 |
| 2020 | $3,955 | $331,800 | $175,400 | $156,400 |
| 2019 | $3,859 | $318,400 | $168,600 | $149,800 |
| 2018 | $3,744 | $299,500 | $160,600 | $138,900 |
| 2017 | $3,591 | $280,300 | $153,000 | $127,300 |
| 2016 | $3,450 | $269,500 | $147,100 | $122,400 |
| 2015 | $3,146 | $243,900 | $132,400 | $111,500 |
| 2014 | $3,197 | $240,400 | $136,900 | $103,500 |
Source: Public Records
Map
Nearby Homes
- 261 Pleasant St Unit 5
- 45 Union St
- 27 Park Ave
- 120 Burkhall St Unit K
- 5 Oak St
- 206 Pine St
- 30 Alroy Rd
- 299 Union St
- 54 Fountain Ln Unit 9
- 41 Oak St
- 200 Burkhall St Unit 803
- 685 Main St Unit 3
- 159 Tall Oaks Dr Unit D
- 2 Mitchell Ln Unit B
- 197 White St
- 17 Sears Rd
- 121 Tall Oaks Dr Unit Q
- 1050 Main St Unit 1
- 54 Old Quarry Dr
- 446 Ralph Talbot St
- 96 Ralph Talbot St
- 42 Stephen Rennie Dr
- 108 Ralph Talbot St
- 36 Stephen Rennie Dr
- 86 Ralph Talbot St
- 95 Ralph Talbot St
- 105 Ralph Talbot St
- 43 Stephen Rennie Dr
- 80 Ralph Talbot St
- 118 Ralph Talbot St
- 109 Ralph Talbot St
- 24 Stephen Rennie Dr
- 87 Ralph Talbot St
- 29 Stephen Rennie Dr
- 76 Ralph Talbot St
- 77 Ralph Talbot St
- 72 Ralph Talbot St
- 126 Ralph Talbot St
- 17 Stephen Rennie Dr
- 36 Trafalgar Ct