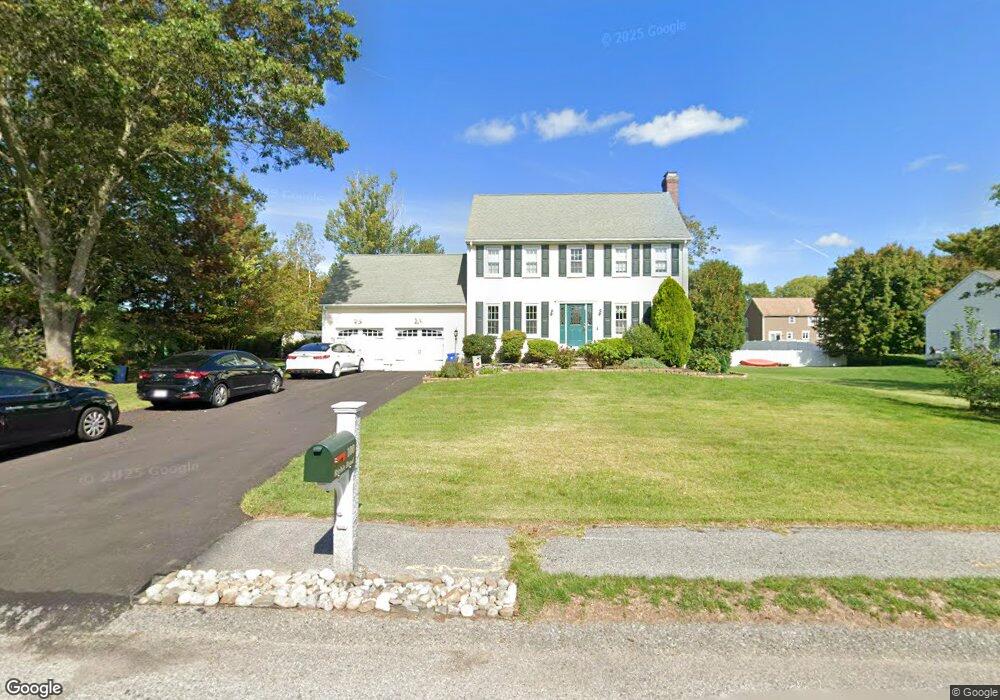
100 Richie Rd Attleboro, MA 02703
Estimated Value: $611,000 - $706,000
3
Beds
2
Baths
1,632
Sq Ft
$395/Sq Ft
Est. Value
About This Home
This home is located at 100 Richie Rd, Attleboro, MA 02703 and is currently estimated at $645,196, approximately $395 per square foot. 100 Richie Rd is a home located in Bristol County with nearby schools including Hyman Fine Elementary School, Wamsutta Middle School, and Attleboro High School.
Ownership History
Date
Name
Owned For
Owner Type
Purchase Details
Closed on
Jan 12, 2021
Sold by
Obrien Kathleen M and Obrien Michael F
Bought by
Obrien Kathleen M
Current Estimated Value
Home Financials for this Owner
Home Financials are based on the most recent Mortgage that was taken out on this home.
Original Mortgage
$348,000
Interest Rate
2.73%
Mortgage Type
Stand Alone Refi Refinance Of Original Loan
Purchase Details
Closed on
Jul 27, 2001
Sold by
Collins Jeffrey and Collins Colleen
Bought by
Obrien Michael F and Obrien Kathleen M
Home Financials for this Owner
Home Financials are based on the most recent Mortgage that was taken out on this home.
Original Mortgage
$231,900
Interest Rate
7.18%
Mortgage Type
Purchase Money Mortgage
Purchase Details
Closed on
Jun 26, 1998
Sold by
Warsing Kathleen A and Warsing Allan C
Bought by
Collins Jeffrey and Collins Colleen
Home Financials for this Owner
Home Financials are based on the most recent Mortgage that was taken out on this home.
Original Mortgage
$160,800
Interest Rate
7.09%
Mortgage Type
Purchase Money Mortgage
Purchase Details
Closed on
Jan 13, 1995
Sold by
Allen Homes Lp 1
Bought by
Warsing Kathleen A
Create a Home Valuation Report for This Property
The Home Valuation Report is an in-depth analysis detailing your home's value as well as a comparison with similar homes in the area
Home Values in the Area
Average Home Value in this Area
Purchase History
| Date | Buyer | Sale Price | Title Company |
|---|---|---|---|
| Obrien Kathleen M | -- | None Available | |
| Obrien Michael F | $289,900 | -- | |
| Collins Jeffrey | $201,000 | -- | |
| Warsing Kathleen A | $154,900 | -- |
Source: Public Records
Mortgage History
| Date | Status | Borrower | Loan Amount |
|---|---|---|---|
| Previous Owner | Obrien Kathleen M | $348,000 | |
| Previous Owner | Warsing Kathleen A | $54,100 | |
| Previous Owner | Warsing Kathleen A | $231,900 | |
| Previous Owner | Warsing Kathleen A | $160,800 |
Source: Public Records
Tax History Compared to Growth
Tax History
| Year | Tax Paid | Tax Assessment Tax Assessment Total Assessment is a certain percentage of the fair market value that is determined by local assessors to be the total taxable value of land and additions on the property. | Land | Improvement |
|---|---|---|---|---|
| 2025 | $6,624 | $527,800 | $174,300 | $353,500 |
| 2024 | $6,249 | $490,900 | $156,900 | $334,000 |
| 2023 | $5,913 | $431,900 | $158,500 | $273,400 |
| 2022 | $5,679 | $393,000 | $151,100 | $241,900 |
| 2021 | $5,652 | $381,900 | $145,300 | $236,600 |
| 2020 | $5,383 | $369,700 | $138,700 | $231,000 |
| 2019 | $5,236 | $369,800 | $136,100 | $233,700 |
| 2018 | $9,086 | $342,700 | $132,100 | $210,600 |
| 2017 | $4,941 | $339,600 | $128,700 | $210,900 |
| 2016 | $4,778 | $322,400 | $120,100 | $202,300 |
| 2015 | $4,644 | $315,700 | $120,100 | $195,600 |
| 2014 | $4,514 | $304,000 | $114,900 | $189,100 |
Source: Public Records
Map
Nearby Homes
- 51 Saveena Dr
- 599 Oakhill Ave
- 58 Saveena Dr
- 96 Mary Rocha Way
- 10 French Farm Rd
- 74 Saveena Dr
- 78 Saveena Dr
- 38 Standish Rd
- 2 Valley Run Dr
- 12 Valley Run Dr
- 1080 Oakhill Ave
- 172 Downing Dr
- 73 Valley Run Dr
- 12 Knollcrest Cir
- 139 Downing Dr
- 71 Parsonage Way
- 45 Spruce Ln
- 1325 Park St
- 3 Wilmarth St
- 429 S Main St Unit 1
- 108 Richie Rd
- 78 Meadowsweet Trail
- 13 Blue Heron Dr Unit Lot 6
- 115 Richie Rd
- 17 Blue Heron Dr
- 17 Blue Heron Dr Unit LOT 5
- 7 Blue Heron Dr
- 70 Meadowsweet Trail
- 116 Richie Rd
- 9 Blue Heron Dr
- 9 Blue Heron Dr Unit Lot 7
- 5 Blue Heron Dr Unit lot 8
- 25 Blue Heron Dr
- 3 Blue Heron Dr
- 107 Richie Rd
- 123 Richie Rd
- 93 Meadowsweet Trail
- 85 Meadowsweet Trail
- 230 Richie Rd
- 124 Richie Rd