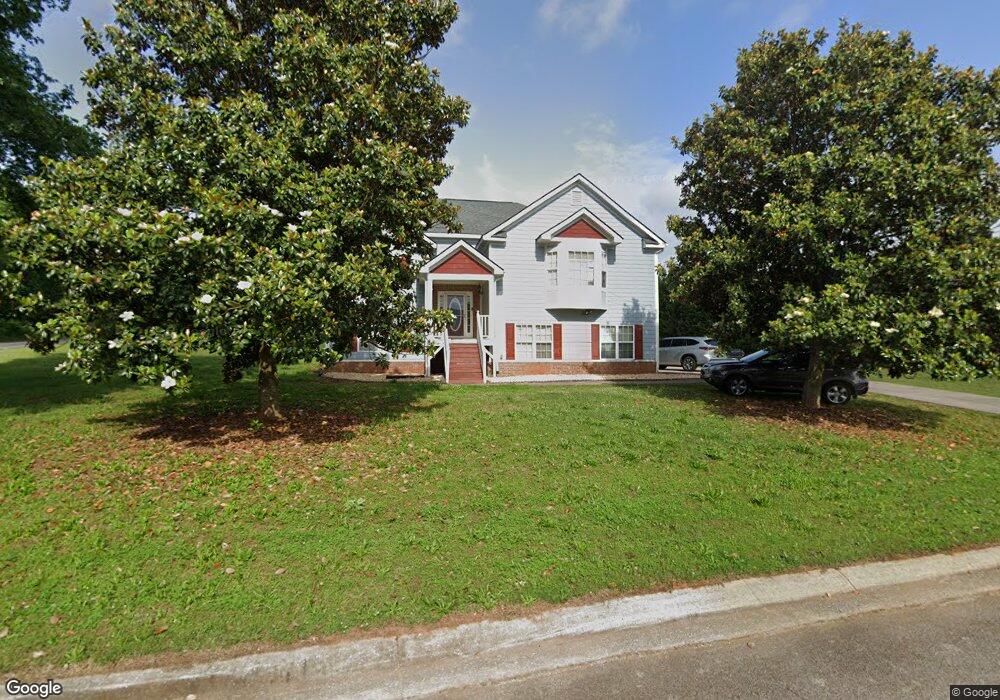
100 Richmond Dr Carrollton, GA 30117
Estimated Value: $295,931 - $360,000
3
Beds
2
Baths
1,743
Sq Ft
$191/Sq Ft
Est. Value
About This Home
This home is located at 100 Richmond Dr, Carrollton, GA 30117 and is currently estimated at $333,733, approximately $191 per square foot. 100 Richmond Dr is a home located in Carroll County with nearby schools including Mt. Zion Elementary School, Mt. Zion Middle School, and Mt. Zion High School.
Ownership History
Date
Name
Owned For
Owner Type
Purchase Details
Closed on
Oct 21, 2022
Sold by
Rubio Jose M
Bought by
Meza Sintia A
Current Estimated Value
Home Financials for this Owner
Home Financials are based on the most recent Mortgage that was taken out on this home.
Original Mortgage
$99,300
Outstanding Balance
$95,973
Interest Rate
6.7%
Mortgage Type
New Conventional
Estimated Equity
$237,760
Purchase Details
Closed on
Sep 4, 2007
Sold by
Not Provided
Bought by
Rubio Jose M
Purchase Details
Closed on
Oct 7, 2003
Sold by
Ranco Construction Co
Bought by
Rubio Jose M and Fuentes Jose A
Purchase Details
Closed on
Aug 20, 2003
Sold by
Ranco Construction C
Bought by
Rubio Jose M and Fuentes Jose A
Purchase Details
Closed on
Apr 25, 2001
Sold by
Baggett Dewayne
Bought by
Ranco Construction C
Purchase Details
Closed on
Jun 27, 2000
Sold by
Poole Gary D
Bought by
Baggett Dewayne
Create a Home Valuation Report for This Property
The Home Valuation Report is an in-depth analysis detailing your home's value as well as a comparison with similar homes in the area
Home Values in the Area
Average Home Value in this Area
Purchase History
| Date | Buyer | Sale Price | Title Company |
|---|---|---|---|
| Meza Sintia A | $165,500 | -- | |
| Rubio Jose M | -- | -- | |
| Rubio Jose M | -- | -- | |
| Rubio Jose M | $149,900 | -- | |
| Ranco Construction C | $38,500 | -- | |
| Baggett Dewayne | $31,600 | -- |
Source: Public Records
Mortgage History
| Date | Status | Borrower | Loan Amount |
|---|---|---|---|
| Open | Meza Sintia A | $99,300 |
Source: Public Records
Tax History Compared to Growth
Tax History
| Year | Tax Paid | Tax Assessment Tax Assessment Total Assessment is a certain percentage of the fair market value that is determined by local assessors to be the total taxable value of land and additions on the property. | Land | Improvement |
|---|---|---|---|---|
| 2024 | $3,060 | $135,278 | $8,000 | $127,278 |
| 2023 | $3,060 | $123,646 | $8,000 | $115,646 |
| 2022 | $2,531 | $100,934 | $8,000 | $92,934 |
| 2021 | $2,244 | $87,520 | $8,000 | $79,520 |
| 2020 | $2,026 | $78,921 | $8,000 | $70,921 |
| 2019 | $1,901 | $73,442 | $8,000 | $65,442 |
| 2018 | $1,758 | $66,958 | $6,000 | $60,958 |
| 2017 | $1,764 | $66,958 | $6,000 | $60,958 |
| 2016 | $1,901 | $72,158 | $11,200 | $60,958 |
| 2015 | $1,225 | $47,804 | $8,000 | $39,804 |
| 2014 | $1,230 | $47,804 | $8,000 | $39,804 |
Source: Public Records
Map
Nearby Homes
- 113 Richmond Dr
- 113 Natures Pointe Trail
- 442 Plowshare Rd
- 304 Kodiak Rd
- 1202 Mount Zion Rd
- The Joey Plan at Hidden Hills
- The Daniel Plan at Hidden Hills
- 50 Green Acres Dr
- 132 Pinnacle Way
- 190 Marvin Gray Rd
- 000 Beulah Church Rd
- 77 Little River Rd
- 1423 Beulah Church Rd
- 2994 Mount Zion Rd
- 2994 Mount Zion Rd Unit 1
- 2994 Mount Zion Rd Unit 3
- 2464 N 27 Highway & Bagwell Rd
- 0 Skinner Rd
- 871 Plowshare Rd
- 112 Richmond Dr Unit 19
- 112 Richmond Dr
- 101 Richmond Dr
- 107 Richmond Dr
- 883 Plowshare Rd
- 124 Richmond Dr
- 136 Richmond Dr
- 131 Richmond Dr
- 142 Richmond Dr
- 100 Virginia Trail
- 100 Virginia Trail
- 100 Virginia Trail
- 104 Virginia Trail
- 143 Richmond Dr
- 920 Plowshare Rd
- 915 Plowshare Rd
- 108 Virginia Trail
- 147 Richmond Dr
- 148 Richmond Dr