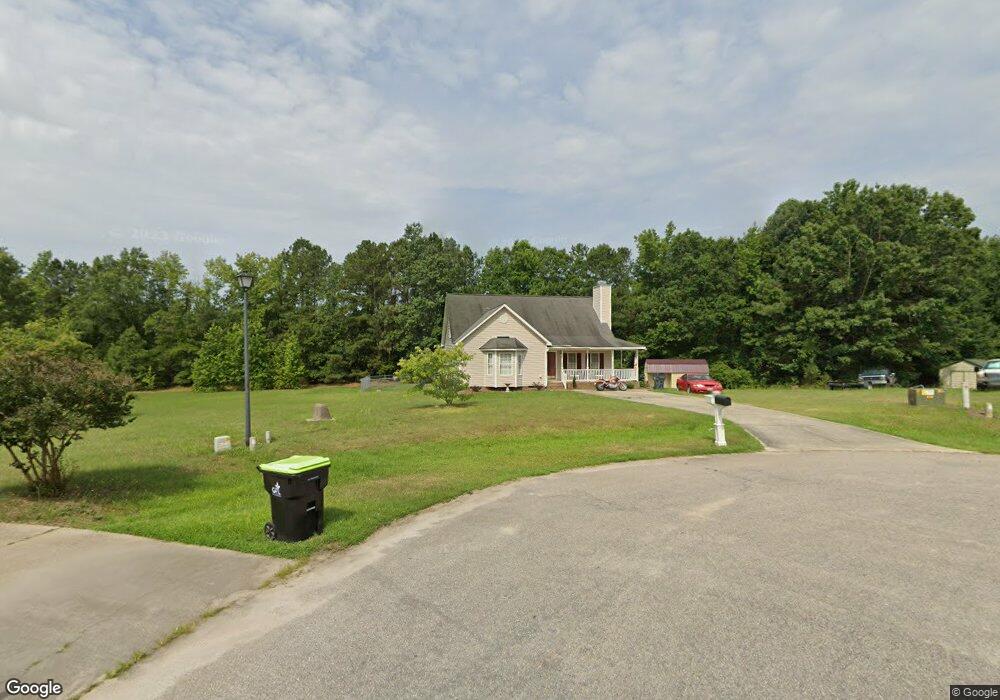
100 Richmond Place Youngsville, NC 27596
Estimated Value: $318,000 - $343,000
3
Beds
2
Baths
1,380
Sq Ft
$238/Sq Ft
Est. Value
About This Home
This home is located at 100 Richmond Place, Youngsville, NC 27596 and is currently estimated at $328,323, approximately $237 per square foot. 100 Richmond Place is a home located in Franklin County with nearby schools including Royal Elementary School, Bunn Middle School, and Bunn High School.
Ownership History
Date
Name
Owned For
Owner Type
Purchase Details
Closed on
Sep 27, 2018
Sold by
Woodall Charles A
Bought by
Jones Emily Diane and Jones Michael Oliver
Current Estimated Value
Home Financials for this Owner
Home Financials are based on the most recent Mortgage that was taken out on this home.
Original Mortgage
$162,011
Outstanding Balance
$140,700
Interest Rate
4.5%
Mortgage Type
FHA
Estimated Equity
$187,623
Purchase Details
Closed on
Oct 30, 2009
Sold by
Cooper Danica L and Cooper Aubrey L
Bought by
Woodall Charles A
Home Financials for this Owner
Home Financials are based on the most recent Mortgage that was taken out on this home.
Original Mortgage
$147,959
Interest Rate
5.04%
Mortgage Type
New Conventional
Purchase Details
Closed on
Aug 21, 2006
Sold by
Perry James L and Perry Faye R
Bought by
Bmj Consulting Llc
Purchase Details
Closed on
Nov 1, 2002
Bought by
Cooper Danica L and Cooper Aubrey L
Create a Home Valuation Report for This Property
The Home Valuation Report is an in-depth analysis detailing your home's value as well as a comparison with similar homes in the area
Home Values in the Area
Average Home Value in this Area
Purchase History
| Date | Buyer | Sale Price | Title Company |
|---|---|---|---|
| Jones Emily Diane | $165,000 | None Available | |
| Woodall Charles A | $145,000 | None Available | |
| Bmj Consulting Llc | $25,000 | None Available | |
| Cooper Danica L | $133,000 | -- |
Source: Public Records
Mortgage History
| Date | Status | Borrower | Loan Amount |
|---|---|---|---|
| Open | Jones Emily Diane | $162,011 | |
| Previous Owner | Woodall Charles A | $147,959 |
Source: Public Records
Tax History Compared to Growth
Tax History
| Year | Tax Paid | Tax Assessment Tax Assessment Total Assessment is a certain percentage of the fair market value that is determined by local assessors to be the total taxable value of land and additions on the property. | Land | Improvement |
|---|---|---|---|---|
| 2025 | $1,778 | $292,680 | $120,000 | $172,680 |
| 2024 | $1,749 | $292,680 | $120,000 | $172,680 |
| 2023 | $1,617 | $175,230 | $38,500 | $136,730 |
| 2022 | $1,607 | $175,230 | $38,500 | $136,730 |
| 2021 | $1,625 | $175,230 | $38,500 | $136,730 |
| 2020 | $1,634 | $175,230 | $38,500 | $136,730 |
| 2019 | $1,609 | $175,230 | $38,500 | $136,730 |
| 2018 | $1,606 | $175,230 | $38,500 | $136,730 |
| 2017 | $1,437 | $141,670 | $35,000 | $106,670 |
| 2016 | $1,486 | $141,670 | $35,000 | $106,670 |
| 2015 | $1,486 | $141,670 | $35,000 | $106,670 |
| 2014 | $1,387 | $141,670 | $35,000 | $106,670 |
Source: Public Records
Map
Nearby Homes
- 20 Richmond Place
- 90 Eagle Chase Dr
- 136 Dixie Ln
- 65 Linnett Ct
- 150 Williamston Ridge Dr
- 20 Willows Den Ct
- 138 Bridle Trail
- 10 Shorrey Place
- 95 Shorrey Place
- 5916 2 Pines Trail
- 463 Robbins Rd
- 7001 Barham Hollow Dr
- 6733 Oscar Barham Rd
- 5021 Mitchell Town Rd
- 5017 Mitchell Town Rd
- 85 Weathered Oak Way
- 5013 Mitchell Town Rd
- 3555 Nc 98 Hwy W
- 0 S Us 401 Hwy
- 205 Diamond Creek Dr
- 95 Richmond Place
- 90 Richmond Place
- 10 Boca Place
- 80 Richmond Place
- 20 Boca Place
- Lot 68 Boca Place
- Lot 70 Boca Place
- Lot 69 Boca Place
- 70 Richmond Place
- 64 Richmond Place
- 15 Boca Place
- 60 Richmond Place
- 25 Boca Place
- 58 Richmond Place
- 35 Boca Place
- 35 Boca Place Unit 69
- 56 Richmond Place
- 30 Boca Place
- 30 Boca Place Unit 70
- 54 Richmond Place