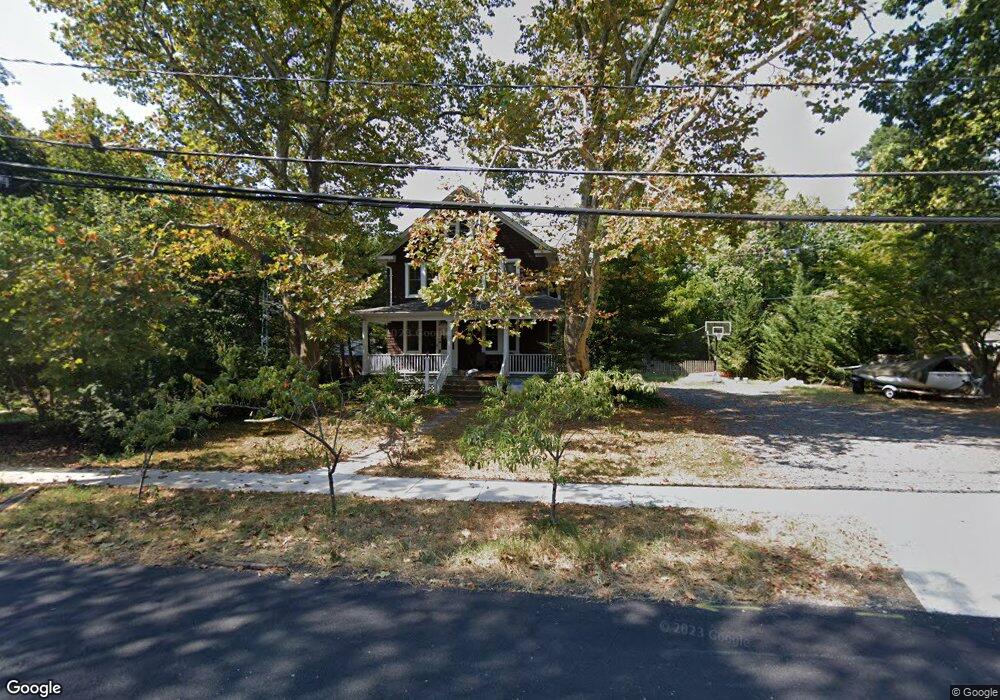
100 Riggs Ave Severna Park, MD 21146
Estimated Value: $789,000 - $1,120,000
5
Beds
4
Baths
3,044
Sq Ft
$314/Sq Ft
Est. Value
About This Home
This home is located at 100 Riggs Ave, Severna Park, MD 21146 and is currently estimated at $957,199, approximately $314 per square foot. 100 Riggs Ave is a home located in Anne Arundel County with nearby schools including Severna Park Elementary School, Severna Park Middle School, and Severna Park High School.
Ownership History
Date
Name
Owned For
Owner Type
Purchase Details
Closed on
Nov 17, 2016
Bought by
Perry Anthony
Current Estimated Value
Home Financials for this Owner
Home Financials are based on the most recent Mortgage that was taken out on this home.
Original Mortgage
$518,700
Outstanding Balance
$423,114
Interest Rate
3.94%
Estimated Equity
$534,085
Purchase Details
Closed on
Mar 21, 2011
Sold by
Bank Of New York Mellon
Bought by
Perry Anthony D and Perry Mary C
Home Financials for this Owner
Home Financials are based on the most recent Mortgage that was taken out on this home.
Original Mortgage
$363,580
Interest Rate
4.83%
Mortgage Type
FHA
Purchase Details
Closed on
Sep 22, 2010
Sold by
Richardson John S
Bought by
Bank Of New York Mellon
Purchase Details
Closed on
Jul 19, 1991
Sold by
Smith Cooper
Bought by
Richardson John S
Home Financials for this Owner
Home Financials are based on the most recent Mortgage that was taken out on this home.
Original Mortgage
$140,000
Interest Rate
9.54%
Create a Home Valuation Report for This Property
The Home Valuation Report is an in-depth analysis detailing your home's value as well as a comparison with similar homes in the area
Home Values in the Area
Average Home Value in this Area
Purchase History
| Date | Buyer | Sale Price | Title Company |
|---|---|---|---|
| Perry Anthony | -- | -- | |
| Perry Anthony D | $389,800 | -- | |
| Bank Of New York Mellon | $465,930 | -- | |
| Richardson John S | $175,000 | -- |
Source: Public Records
Mortgage History
| Date | Status | Borrower | Loan Amount |
|---|---|---|---|
| Open | Perry Anthony | $518,700 | |
| Closed | Perry Anthony | -- | |
| Previous Owner | Perry Anthony D | $363,580 | |
| Previous Owner | Richardson John S | $140,000 |
Source: Public Records
Tax History
| Year | Tax Paid | Tax Assessment Tax Assessment Total Assessment is a certain percentage of the fair market value that is determined by local assessors to be the total taxable value of land and additions on the property. | Land | Improvement |
|---|---|---|---|---|
| 2025 | $5,664 | $700,433 | -- | -- |
| 2024 | $5,664 | $620,300 | $428,900 | $191,400 |
| 2023 | $5,060 | $620,300 | $428,900 | $191,400 |
| 2022 | $5,541 | $620,300 | $428,900 | $191,400 |
| 2020 | $5,277 | $598,833 | $0 | $0 |
| 2019 | $5,157 | $558,767 | $0 | $0 |
| 2018 | $5,260 | $518,700 | $336,400 | $182,300 |
| 2017 | $4,784 | $472,533 | $0 | $0 |
| 2016 | -- | $426,367 | $0 | $0 |
| 2015 | -- | $380,200 | $0 | $0 |
| 2014 | -- | $376,700 | $0 | $0 |
Source: Public Records
Map
Nearby Homes
- 728 Ticonderoga Ave
- 738 Ticonderoga Ave
- 748 Ticonderoga Ave
- 0 Baltimore Annapolis Blvd
- 600 Mckinsey Park Dr Unit 102
- 9 Robinson Rd
- 304 Forest Ct
- 143 Boone Trail
- 800 Baltimore Annapolis Blvd
- 100 Rustic Ridge Rd
- 408 Mcbride Ln
- 207 Oak Ave
- 880 Baltimore Annapolis Blvd
- 246 Cypress Creek Rd
- 512 Saint Martins Ln
- 1394 Baltimore and Annapolis Trail
- 903 Old County Rd
- 331 Ritchie Hwy
- 812 Birch Run Terrace
- 853 Buckingham Cove Rd
- 102 Riggs Ave
- 106 Riggs Ave
- 101 Riggs Ave
- 104 Evergreen Rd
- 102 Evergreen Rd
- 106 Evergreen Rd
- 103 Riggs Ave
- 108 Evergreen Rd
- 112 Evergreen Rd
- 105 Riggs Ave
- 111 Evergreen Rd
- 100 Evergreen Rd
- 108 Riggs Ave
- 104 Maple Ave
- 107 Riggs Ave
- 10 Riggs Ave
- 101 Avondale Cir
- 106 Maple Ave
- 110 Riggs Ave
- 103 Avondale Cir