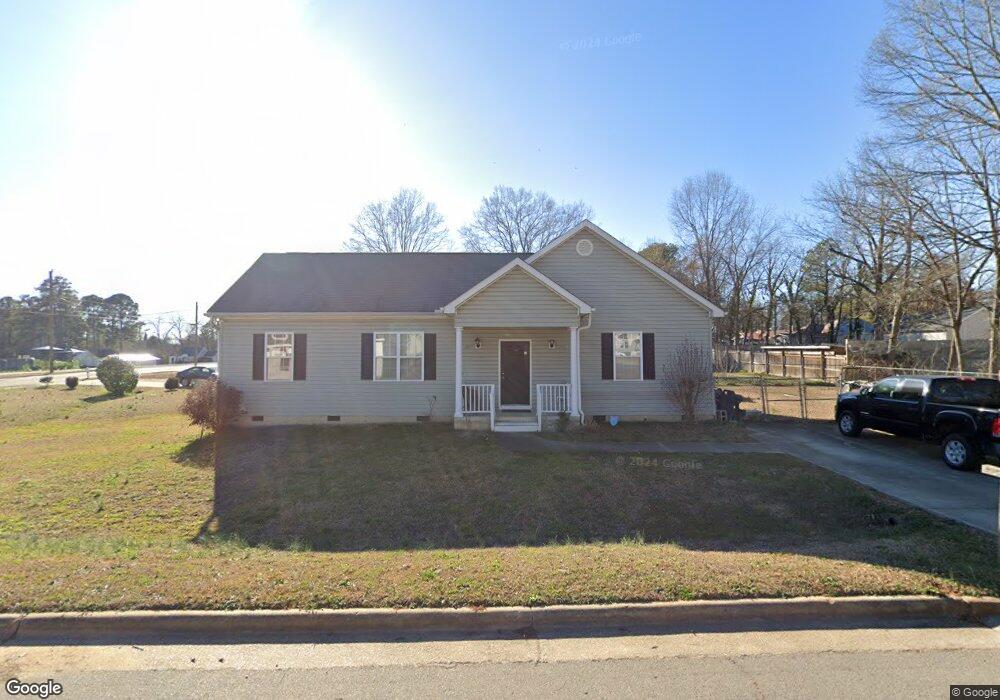
100 S 8th St Sanford, NC 27330
Estimated Value: $184,000 - $215,000
3
Beds
2
Baths
1,248
Sq Ft
$157/Sq Ft
Est. Value
About This Home
This home is located at 100 S 8th St, Sanford, NC 27330 and is currently estimated at $196,415, approximately $157 per square foot. 100 S 8th St is a home located in Lee County with nearby schools including Deep River Elementary School, East Lee Middle School, and Lee County High School.
Ownership History
Date
Name
Owned For
Owner Type
Purchase Details
Closed on
Aug 10, 2021
Sold by
Lee Capital Investments Llc
Bought by
Spivey Kelly Brandon and Spivey Sion
Current Estimated Value
Home Financials for this Owner
Home Financials are based on the most recent Mortgage that was taken out on this home.
Original Mortgage
$100,000
Outstanding Balance
$84,002
Interest Rate
2.9%
Mortgage Type
New Conventional
Estimated Equity
$112,413
Purchase Details
Closed on
Sep 14, 2012
Sold by
First Troy Spe Llc
Bought by
Lee Capital Investments Llc
Purchase Details
Closed on
May 13, 2001
Sold by
Lw Rickard Properties Llc
Bought by
Gonzalez Monico and Tavera Maria Yolanda Morales
Home Financials for this Owner
Home Financials are based on the most recent Mortgage that was taken out on this home.
Original Mortgage
$116,860
Interest Rate
4.75%
Mortgage Type
FHA
Purchase Details
Closed on
Dec 21, 1993
Bought by
Perry John
Create a Home Valuation Report for This Property
The Home Valuation Report is an in-depth analysis detailing your home's value as well as a comparison with similar homes in the area
Home Values in the Area
Average Home Value in this Area
Purchase History
| Date | Buyer | Sale Price | Title Company |
|---|---|---|---|
| Spivey Kelly Brandon | $125,000 | None Available | |
| Lee Capital Investments Llc | $53,000 | -- | |
| Gonzalez Monico | $120,000 | None Available | |
| Perry John | -- | -- |
Source: Public Records
Mortgage History
| Date | Status | Borrower | Loan Amount |
|---|---|---|---|
| Open | Spivey Kelly Brandon | $100,000 | |
| Previous Owner | Gonzalez Monico | $116,860 |
Source: Public Records
Tax History Compared to Growth
Tax History
| Year | Tax Paid | Tax Assessment Tax Assessment Total Assessment is a certain percentage of the fair market value that is determined by local assessors to be the total taxable value of land and additions on the property. | Land | Improvement |
|---|---|---|---|---|
| 2025 | $1,718 | $145,000 | $14,700 | $130,300 |
| 2024 | $1,718 | $145,000 | $14,700 | $130,300 |
| 2023 | $1,718 | $145,000 | $14,700 | $130,300 |
| 2022 | $1,247 | $92,400 | $4,400 | $88,000 |
| 2021 | $1,275 | $92,400 | $4,400 | $88,000 |
| 2020 | $1,271 | $92,400 | $4,400 | $88,000 |
| 2019 | $1,271 | $92,400 | $4,400 | $88,000 |
| 2018 | $1,332 | $94,100 | $4,700 | $89,400 |
| 2017 | $1,313 | $94,100 | $4,700 | $89,400 |
| 2016 | $1,313 | $94,100 | $4,700 | $89,400 |
| 2014 | $1,242 | $94,100 | $4,700 | $89,400 |
Source: Public Records
Map
Nearby Homes
- 305 Maple Ave
- Lot 21 Goldsboro Ave
- Lot 20 Goldsboro Ave
- Lot 19 Goldsboro Ave
- Lot 18 Goldsboro Ave
- Lot 17 Goldsboro Ave
- Lot 16 Goldsboro Ave
- Lot 15 Goldsboro Ave
- Lot 14 Goldsboro Ave
- 106 Driftwood Ct
- 117 Godwin Ct
- 211 Uwharrie Way
- Denville Plan at Townes at Central Square - Smart Living
- Augusta Plan at Townes at Central Square - Smart Living
- Lot 4 Cooper St
- Lot 3 Cooper St
- Lot 2 Cooper St
- 510 Charlotte Ave
- 518 Charlotte Ave
- 0 Charlotte Ave
- 506 Charlotte Ave
- 520 Charlotte Ave
- 102 S 8th St
- 109 S 8th St
- 109 S 8th St Unit 111
- 509 Mciver St
- 524 Charlotte Ave
- 504 Charlotte Ave
- 507 Mciver St
- 517 Mciver St
- 509 Charlotte Ave
- 505 Mciver St
- 109 S 7th St
- 507 Charlotte Ave
- 517 Charlotte Ave
- 519 Mciver St Unit 521
- 101 S 7th St