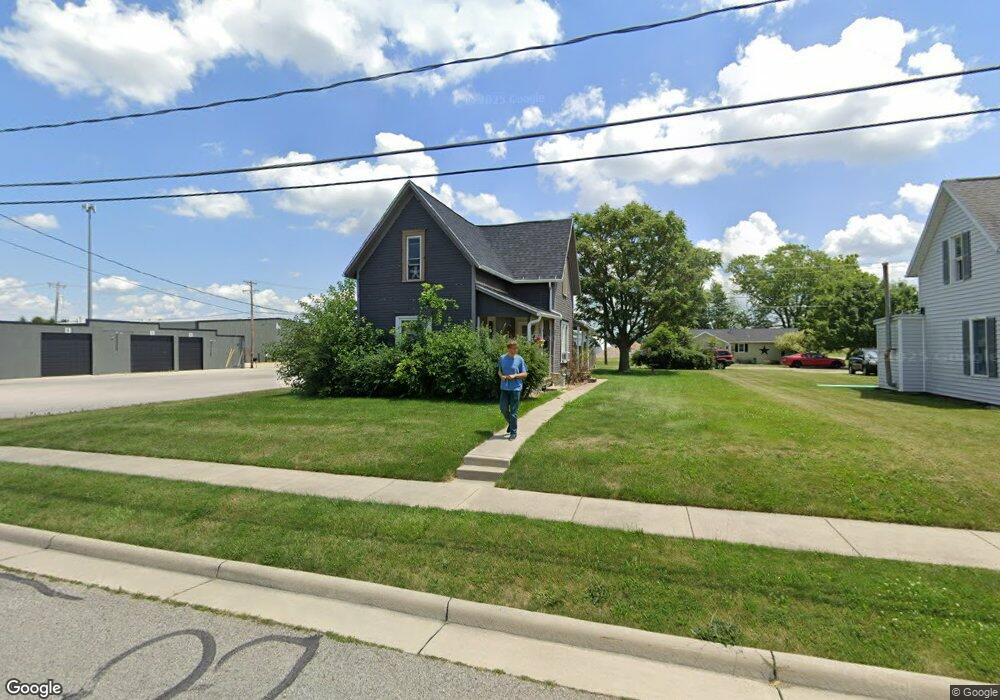
100 S Lincoln St Archbold, OH 43502
Estimated Value: $108,000 - $135,000
2
Beds
1
Bath
1,090
Sq Ft
$114/Sq Ft
Est. Value
About This Home
This home is located at 100 S Lincoln St, Archbold, OH 43502 and is currently estimated at $124,037, approximately $113 per square foot. 100 S Lincoln St is a home located in Fulton County with nearby schools including Archbold Elementary School, Archbold Middle School, and Archbold High School.
Ownership History
Date
Name
Owned For
Owner Type
Purchase Details
Closed on
Jan 9, 2020
Sold by
Litchfield Ronald L
Bought by
Minnemeyer Christine
Current Estimated Value
Home Financials for this Owner
Home Financials are based on the most recent Mortgage that was taken out on this home.
Original Mortgage
$45,000
Outstanding Balance
$39,759
Interest Rate
3.6%
Mortgage Type
Closed End Mortgage
Estimated Equity
$84,278
Purchase Details
Closed on
May 5, 2019
Sold by
Litchfield Ronald L
Bought by
Minnemeyer Christine
Purchase Details
Closed on
Jun 14, 1999
Sold by
Rupp William G
Bought by
Litchfield Ronald L
Home Financials for this Owner
Home Financials are based on the most recent Mortgage that was taken out on this home.
Original Mortgage
$32,775
Interest Rate
6.99%
Mortgage Type
New Conventional
Purchase Details
Closed on
Jan 1, 1990
Bought by
County Line Trucking Inc
Create a Home Valuation Report for This Property
The Home Valuation Report is an in-depth analysis detailing your home's value as well as a comparison with similar homes in the area
Home Values in the Area
Average Home Value in this Area
Purchase History
| Date | Buyer | Sale Price | Title Company |
|---|---|---|---|
| Minnemeyer Christine | $45,000 | None Available | |
| Minnemeyer Christine | -- | None Available | |
| Litchfield Ronald L | $34,500 | -- | |
| County Line Trucking Inc | -- | -- |
Source: Public Records
Mortgage History
| Date | Status | Borrower | Loan Amount |
|---|---|---|---|
| Open | Minnemeyer Christine | $45,000 | |
| Previous Owner | Litchfield Ronald L | $32,775 |
Source: Public Records
Tax History Compared to Growth
Tax History
| Year | Tax Paid | Tax Assessment Tax Assessment Total Assessment is a certain percentage of the fair market value that is determined by local assessors to be the total taxable value of land and additions on the property. | Land | Improvement |
|---|---|---|---|---|
| 2024 | $1,322 | $25,140 | $8,440 | $16,700 |
| 2023 | $1,322 | $25,140 | $8,440 | $16,700 |
| 2022 | $967 | $19,400 | $7,040 | $12,360 |
| 2021 | $968 | $19,400 | $7,040 | $12,360 |
| 2020 | $964 | $19,400 | $7,040 | $12,360 |
| 2019 | $991 | $19,010 | $7,040 | $11,970 |
| 2018 | $691 | $19,010 | $7,040 | $11,970 |
| 2017 | $666 | $19,010 | $7,040 | $11,970 |
| 2016 | $422 | $17,440 | $7,040 | $10,400 |
| 2015 | $370 | $17,440 | $7,040 | $10,400 |
| 2014 | $369 | $17,440 | $7,040 | $10,400 |
| 2013 | $373 | $17,120 | $6,760 | $10,360 |
Source: Public Records
Map
Nearby Homes
- 307 Middle St
- 813 Murbach St
- 804 Murbach St
- 0 S Defiance St
- 200 Burke St
- 404 Walnut St
- 300 Degroff Ave
- 301 N Pointe Dr
- 0 Lafayette St
- 112 Sylvanus St
- 433 Primrose Ln
- 552 Quail Run
- 24218 State Route 2
- 209 Hawthorn Dr
- 352 German St
- 7170 County Road 23
- 0 County Road F
- 5445 County Road 19
- 22018 County Road F
- 19950 County Road X
- 102 S Lincoln St
- 0 Jackson St
- 104 S Lincoln St
- 104 S Lincoln St Unit 104 1/2 S Lincoln
- 104 S Lincoln St Unit 104 S. Lincoln St
- 306 North St
- 503 Jackson St
- 200 S Lincoln St
- 301 North St
- 502 Jackson St
- 303 North St
- 110 Middle St
- 304 North St
- 205 S Lincoln St
- 206 S Lincoln St
- 200 North St
- 303 E Mechanic St
- 200 Middle St
- 506 South St
- 500 South St