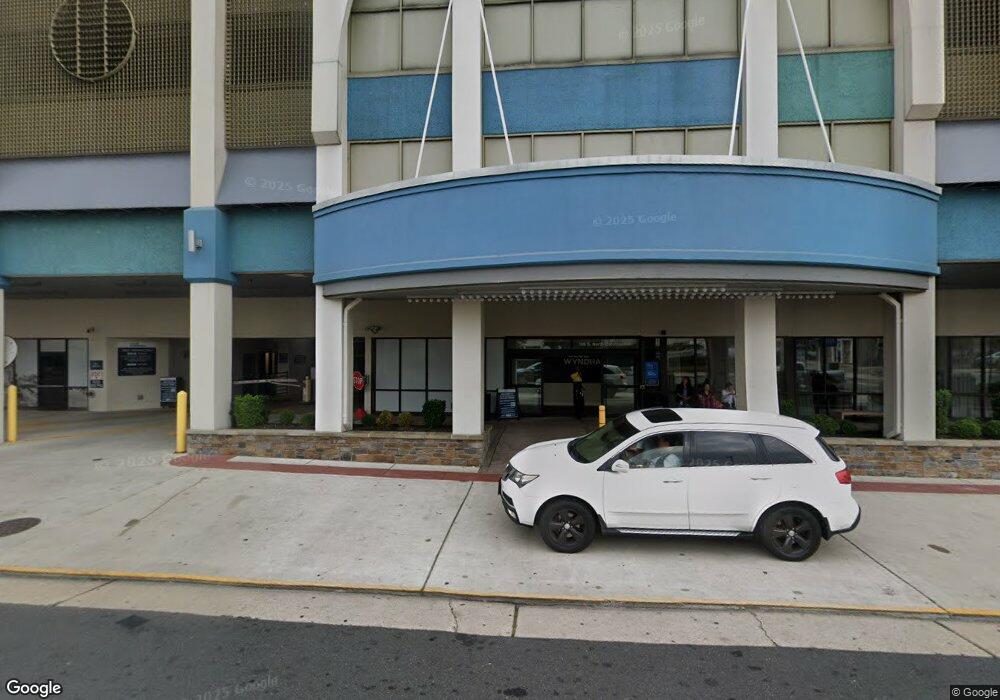
100 S North Carolina Ave Unit 3012 Atlantic City, NJ 08401
Downtown Atlantic City NeighborhoodEstimated Value: $288,000 - $315,000
--
Bed
--
Bath
1,173
Sq Ft
$253/Sq Ft
Est. Value
About This Home
This home is located at 100 S North Carolina Ave Unit 3012, Atlantic City, NJ 08401 and is currently estimated at $297,135, approximately $253 per square foot. 100 S North Carolina Ave Unit 3012 is a home located in Atlantic County with nearby schools including Pennsylvania Avenue School, Atlantic City High School, and New Hope Christian Academy/Robinson Small Learning Center.
Ownership History
Date
Name
Owned For
Owner Type
Purchase Details
Closed on
Jan 28, 2025
Sold by
County Of Atlantic
Bought by
Wyndham Vacation Resorts Inc
Current Estimated Value
Purchase Details
Closed on
Sep 9, 2024
Sold by
Horowitz Robert and Horowitz Rosario
Bought by
Wyndham Vacation Resorts Inc
Purchase Details
Closed on
Aug 27, 2024
Sold by
Garrigus Steven and Garrigus Lesley E
Bought by
Sharetime Holdings Llc
Purchase Details
Closed on
Apr 25, 2024
Sold by
Mcavoy Kevin M and Mcavoy Christine C
Bought by
Wyndham Vacation Resorts Inc
Purchase Details
Closed on
Nov 20, 2023
Sold by
Crenshaw Saquan Melique Henry
Bought by
Wyndham Vacation Resorts Inc
Create a Home Valuation Report for This Property
The Home Valuation Report is an in-depth analysis detailing your home's value as well as a comparison with similar homes in the area
Home Values in the Area
Average Home Value in this Area
Purchase History
| Date | Buyer | Sale Price | Title Company |
|---|---|---|---|
| Wyndham Vacation Resorts Inc | $1,000 | None Listed On Document | |
| Wyndham Vacation Resorts Inc | $2,000 | None Listed On Document | |
| Sharetime Holdings Llc | -- | None Listed On Document | |
| Wyndham Vacation Resorts Inc | -- | None Listed On Document | |
| Wyndham Vacation Resorts Inc | $2,000 | None Listed On Document | |
| Wyndham Vacation Resorts Inc | $2,000 | Title Services |
Source: Public Records
Tax History Compared to Growth
Tax History
| Year | Tax Paid | Tax Assessment Tax Assessment Total Assessment is a certain percentage of the fair market value that is determined by local assessors to be the total taxable value of land and additions on the property. | Land | Improvement |
|---|---|---|---|---|
| 2025 | $5,937 | $172,000 | $45,000 | $127,000 |
| 2024 | $5,937 | $172,000 | $45,000 | $127,000 |
| 2023 | $6,496 | $172,000 | $45,000 | $127,000 |
| 2022 | $6,496 | $172,000 | $45,000 | $127,000 |
| 2021 | $6,710 | $172,000 | $45,000 | $127,000 |
| 2020 | $6,766 | $172,000 | $45,000 | $127,000 |
| 2019 | $3,785 | $95,000 | $47,500 | $47,500 |
| 2018 | $4,169 | $118,000 | $59,000 | $59,000 |
| 2017 | $4,817 | $140,800 | $70,400 | $70,400 |
| 2016 | $7,133 | $184,800 | $92,400 | $92,400 |
| 2015 | $7,186 | $210,000 | $105,000 | $105,000 |
| 2014 | $9,709 | $290,000 | $162,600 | $127,400 |
Source: Public Records
Map
Nearby Homes
- 44 S Mansion Ave
- 42 S Mansion Ave
- 102 S Ocean Ave
- 18 S Pennsylvania Ave
- 124 S Ocean Ave
- 151 S Ocean Ave
- 171 S Tennessee Ave
- 56 N Pennsylvania Ave Unit 5
- 48 N Pennsylvania Ave
- 925 Atlantic Ave
- 107 S Kentucky Ave
- 2 Steermans Place
- 1 Steermans Place
- 1534 Atlantic Ave
- 1019 Arctic Ave
- 1013 Arctic Ave
- 1515 Boardwalk Unit 809
- 1515 Boardwalk Unit 2911
- 1515 Boardwalk Unit 2805
- 1515 Boardwalk Unit 2704
- 100 S North Carolina Ave Unit 706
- 100 S North Carolina Ave Unit 3301
- 100 S North Carolina Ave Unit 3206
- 100 S North Carolina Ave Unit 3205
- 100 S North Carolina Ave Unit 3204
- 100 S North Carolina Ave Unit 3203
- 100 S North Carolina Ave Unit 3202
- 100 S North Carolina Ave Unit 3201
- 100 S North Carolina Ave Unit 3112
- 100 S North Carolina Ave Unit 3111
- 100 S North Carolina Ave Unit 3110
- 100 S North Carolina Ave Unit 3109
- 100 S North Carolina Ave Unit 3108
- 100 S North Carolina Ave Unit 3107
- 100 S North Carolina Ave Unit 3106
- 100 S North Carolina Ave Unit 3105
- 100 S North Carolina Ave Unit 3104
- 100 S North Carolina Ave Unit 3103
- 100 S North Carolina Ave Unit 3102
- 100 S North Carolina Ave Unit 3101