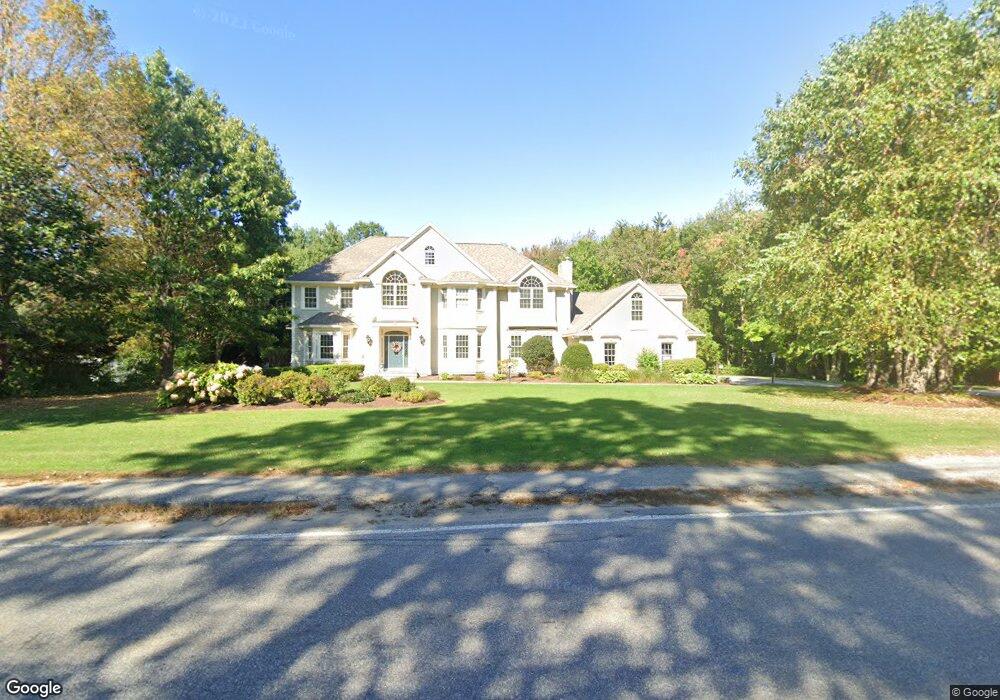
100 Salem St North Andover, MA 01845
Estimated Value: $1,463,000 - $1,590,000
4
Beds
4
Baths
4,365
Sq Ft
$350/Sq Ft
Est. Value
About This Home
This home is located at 100 Salem St, North Andover, MA 01845 and is currently estimated at $1,529,165, approximately $350 per square foot. 100 Salem St is a home located in Essex County with nearby schools including Franklin Elementary School, North Andover Middle School, and North Andover High School.
Ownership History
Date
Name
Owned For
Owner Type
Purchase Details
Closed on
Jul 18, 2014
Sold by
Patenaude Thomas M and Patenaude Lianne
Bought by
Patenaude Lianne
Current Estimated Value
Purchase Details
Closed on
Apr 11, 2007
Sold by
Patenaude Thomas M and Patenaude Lianne
Bought by
Patenaude Thomas M and Patenaude Lianne
Purchase Details
Closed on
Jan 1, 1974
Bought by
Patenaude Lianne
Create a Home Valuation Report for This Property
The Home Valuation Report is an in-depth analysis detailing your home's value as well as a comparison with similar homes in the area
Home Values in the Area
Average Home Value in this Area
Purchase History
| Date | Buyer | Sale Price | Title Company |
|---|---|---|---|
| Patenaude Lianne | -- | -- | |
| Patenaude Thomas M | -- | -- | |
| Patenaude Lianne | -- | -- |
Source: Public Records
Tax History Compared to Growth
Tax History
| Year | Tax Paid | Tax Assessment Tax Assessment Total Assessment is a certain percentage of the fair market value that is determined by local assessors to be the total taxable value of land and additions on the property. | Land | Improvement |
|---|---|---|---|---|
| 2025 | $16,785 | $1,490,700 | $420,600 | $1,070,100 |
| 2024 | $16,086 | $1,450,500 | $398,800 | $1,051,700 |
| 2023 | $15,492 | $1,265,700 | $336,800 | $928,900 |
| 2022 | $14,830 | $1,096,100 | $293,200 | $802,900 |
| 2021 | $14,322 | $1,010,700 | $267,100 | $743,600 |
| 2020 | $13,796 | $1,004,100 | $260,500 | $743,600 |
| 2019 | $13,465 | $1,004,100 | $260,500 | $743,600 |
| 2018 | $14,590 | $1,004,100 | $260,500 | $743,600 |
| 2017 | $14,607 | $1,022,900 | $228,700 | $794,200 |
| 2016 | $13,775 | $965,300 | $230,800 | $734,500 |
| 2015 | $13,604 | $945,400 | $217,400 | $728,000 |
Source: Public Records
Map
Nearby Homes
- 479 Stevens St
- 3 Great Pond Rd
- 174 Chestnut St Unit 14
- 80 Sandra Ln
- 124 Quail Run Rd
- 136 Quail Run Rd
- 116 Mill Pond
- 115 Mill Pond
- 378 Salem St
- 112 Mill Pond
- 98 Mill Pond
- 180 Chickering Rd Unit 310C
- 16 Court St
- 19 Fernview Ave Unit 6
- 19 Fernview Ave Unit 5
- 25 Fernview Ave Unit 8
- 23 Fernview Ave Unit 1
- 40 Fernview Ave Unit 11
- 35 Fernview Ave Unit 5
- 52 Fernview Ave Unit 7