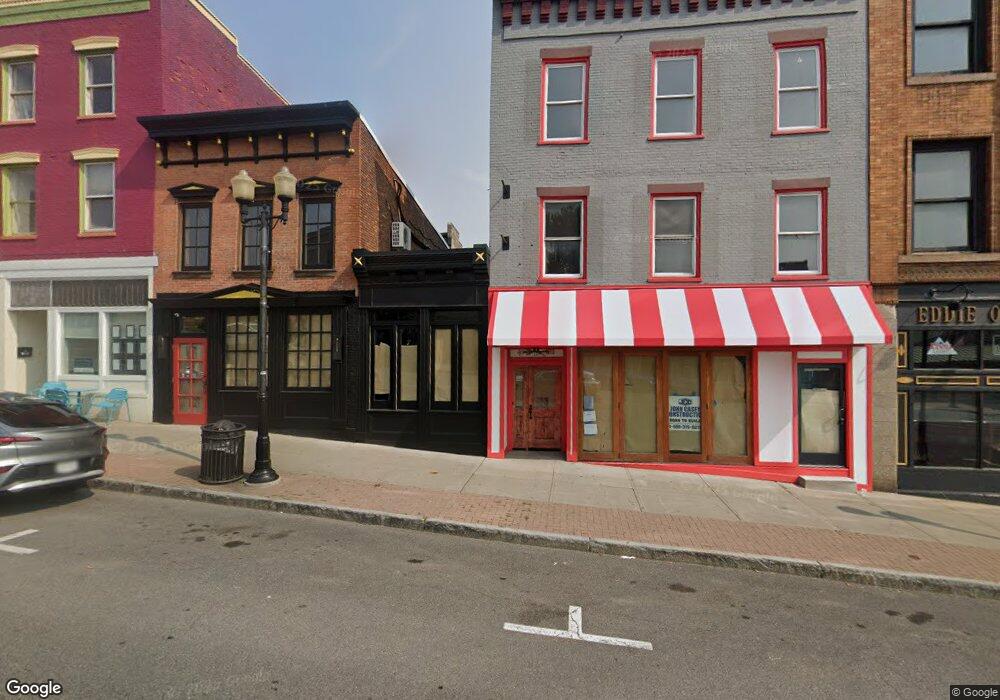
100 Seneca St Geneva, NY 14456
Estimated Value: $926,850
Studio
--
Bath
14,113
Sq Ft
$66/Sq Ft
Est. Value
About This Home
This home is located at 100 Seneca St, Geneva, NY 14456 and is currently estimated at $926,850, approximately $65 per square foot. 100 Seneca St is a home located in Ontario County with nearby schools including West Street Elementary School, North Street Elementary School, and Geneva Middle School.
Ownership History
Date
Name
Owned For
Owner Type
Purchase Details
Closed on
Oct 10, 2024
Sold by
Mitchell Peter H
Bought by
Ar Cecere Properties Llc
Current Estimated Value
Purchase Details
Closed on
Apr 20, 2000
Sold by
Bergstrom Anne P
Bought by
Mitchell Peter
Purchase Details
Closed on
Jan 13, 1995
Sold by
Agnello Roy A Agnello Carol A
Bought by
Mitchell Peter and Bergstrom Anne
Create a Home Valuation Report for This Property
The Home Valuation Report is an in-depth analysis detailing your home's value as well as a comparison with similar homes in the area
Home Values in the Area
Average Home Value in this Area
Purchase History
| Date | Buyer | Sale Price | Title Company |
|---|---|---|---|
| Ar Cecere Properties Llc | $850,000 | None Available | |
| Ar Cecere Properties Llc | $850,000 | None Available | |
| Mitchell Peter | -- | Alaine T Espenscheid | |
| Mitchell Peter | -- | Alaine T Espenscheid | |
| Mitchell Peter | $95,000 | -- | |
| Mitchell Peter | $95,000 | -- |
Source: Public Records
Tax History
| Year | Tax Paid | Tax Assessment Tax Assessment Total Assessment is a certain percentage of the fair market value that is determined by local assessors to be the total taxable value of land and additions on the property. | Land | Improvement |
|---|---|---|---|---|
| 2024 | $12,593 | $336,000 | $26,500 | $309,500 |
| 2023 | $14,905 | $291,500 | $26,500 | $265,000 |
| 2022 | $14,337 | $291,500 | $26,500 | $265,000 |
| 2021 | $14,133 | $291,500 | $26,500 | $265,000 |
| 2020 | $6,120 | $291,500 | $26,500 | $265,000 |
| 2019 | $0 | $262,000 | $26,500 | $235,500 |
| 2018 | $5,959 | $262,000 | $26,500 | $235,500 |
| 2017 | $5,712 | $262,000 | $26,500 | $235,500 |
| 2016 | $5,705 | $262,000 | $26,500 | $235,500 |
| 2015 | -- | $262,000 | $26,500 | $235,500 |
| 2014 | -- | $262,000 | $26,500 | $235,500 |
Source: Public Records
Map
Nearby Homes
- 379 S Main St
- 415 S Main St
- 245 N Main St
- 213 N Main St Unit 215
- 9 Howard St
- 21 Park Ave
- 167 Pulteney St
- 140 Genesee St
- 53 Lewis St
- 163 Cherry St
- 181 Lewis St
- 16 Goodelle Terrace
- 35 Madison St
- 8 Grove St Unit 10
- 212-214 Lewis St
- 193 William St
- 79 N Main St
- 72 Madison St
- 32 Grant Ave
- 160 Lafayette Ave
Your Personal Tour Guide
Ask me questions while you tour the home.