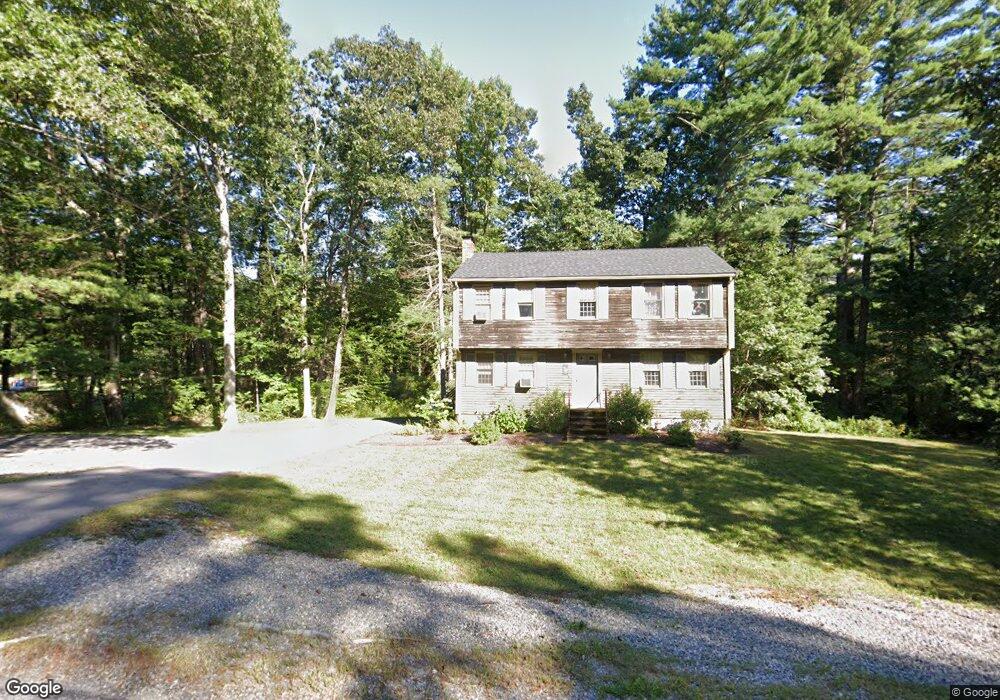
100 Sheldon Rd Wrentham, MA 02093
Sheldonville NeighborhoodEstimated Value: $694,108 - $735,000
4
Beds
3
Baths
1,962
Sq Ft
$363/Sq Ft
Est. Value
About This Home
This home is located at 100 Sheldon Rd, Wrentham, MA 02093 and is currently estimated at $712,277, approximately $363 per square foot. 100 Sheldon Rd is a home located in Norfolk County with nearby schools including Delaney Elementary School, Charles E Roderick, and Mercymount Country Day School.
Ownership History
Date
Name
Owned For
Owner Type
Purchase Details
Closed on
Jan 20, 2026
Sold by
Oneil David F
Bought by
Sheldon Road Rt and Oneil
Current Estimated Value
Purchase Details
Closed on
Sep 30, 2024
Sold by
Oneil Margaret M
Bought by
Oneil David F
Purchase Details
Closed on
Sep 2, 1986
Bought by
Oneil David F and Oneil Margaret M
Create a Home Valuation Report for This Property
The Home Valuation Report is an in-depth analysis detailing your home's value as well as a comparison with similar homes in the area
Home Values in the Area
Average Home Value in this Area
Purchase History
| Date | Buyer | Sale Price | Title Company |
|---|---|---|---|
| Sheldon Road Rt | -- | -- | |
| Oneil David F | -- | None Available | |
| Oneil David F | -- | None Available | |
| Oneil David F | -- | -- |
Source: Public Records
Mortgage History
| Date | Status | Borrower | Loan Amount |
|---|---|---|---|
| Previous Owner | Oneil David F | $116,000 | |
| Previous Owner | Oneil David F | $174,000 | |
| Previous Owner | Oneil David F | $163,200 |
Source: Public Records
Tax History
| Year | Tax Paid | Tax Assessment Tax Assessment Total Assessment is a certain percentage of the fair market value that is determined by local assessors to be the total taxable value of land and additions on the property. | Land | Improvement |
|---|---|---|---|---|
| 2025 | $6,940 | $598,800 | $289,100 | $309,700 |
| 2024 | $6,774 | $564,500 | $289,100 | $275,400 |
| 2023 | $6,533 | $517,700 | $263,000 | $254,700 |
| 2022 | $6,445 | $471,500 | $256,200 | $215,300 |
| 2021 | $6,161 | $437,900 | $239,500 | $198,400 |
| 2020 | $5,595 | $392,600 | $183,100 | $209,500 |
| 2019 | $5,411 | $383,200 | $183,100 | $200,100 |
| 2018 | $5,158 | $362,200 | $164,700 | $197,500 |
| 2017 | $5,043 | $353,900 | $161,600 | $192,300 |
| 2016 | $4,934 | $345,500 | $156,900 | $188,600 |
| 2015 | $4,874 | $325,400 | $150,800 | $174,600 |
| 2014 | $4,795 | $313,200 | $145,100 | $168,100 |
Source: Public Records
Map
Nearby Homes
- 955 Summer St
- 440 Chestnut St
- 613 West St
- 0 Fall Ln
- 20 Field Cir
- 11 Amber Dr
- 19 Chestnut Lot 0
- 1222 South St
- 1565 West St
- 1620 West St
- 9 Reagan Ave
- 139 King St Unit 306
- 18 Huntington Ave
- 10 Earle Stewart Ln Unit Lot 5
- 82 Uncas Ave
- 82 Uncas Ave Unit 1
- 12 Earle Stewart Ln
- 2 Earle Stewart Ln
- 80 Uncas Ave
- 10 Follett Dr
Your Personal Tour Guide
Ask me questions while you tour the home.