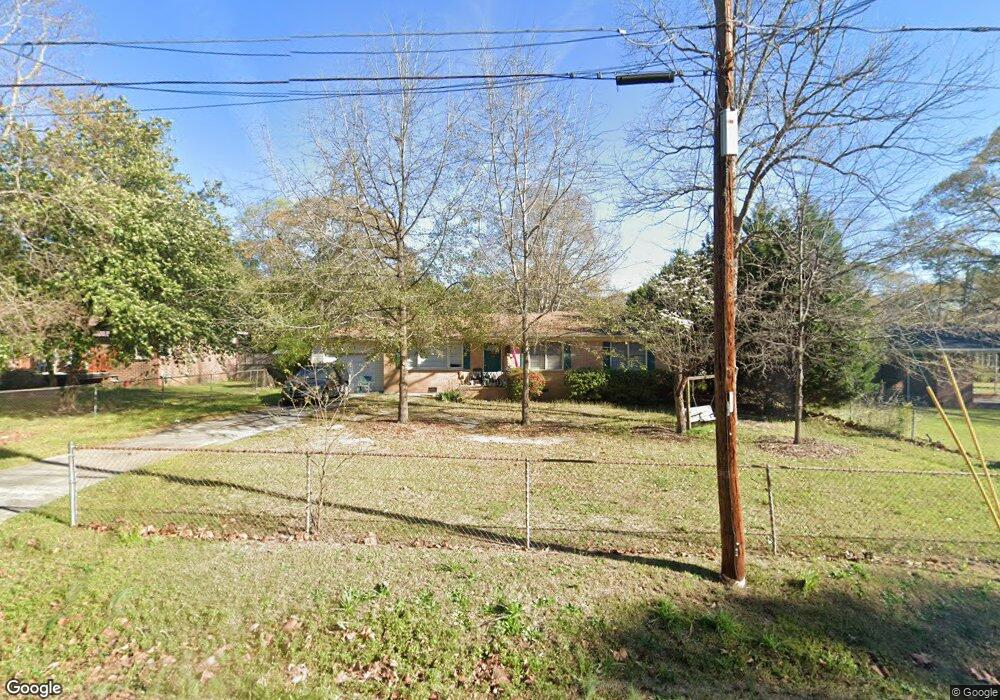
100 Sparta St Warner Robins, GA 31088
Estimated Value: $127,868 - $254,000
Studio
2
Baths
1,302
Sq Ft
$133/Sq Ft
Est. Value
About This Home
This home is located at 100 Sparta St, Warner Robins, GA 31088 and is currently estimated at $173,467, approximately $133 per square foot. 100 Sparta St is a home located in Houston County with nearby schools including C. B. Watson Primary School, Pearl Stephens Elementary School, and Huntington Middle School.
Ownership History
Date
Name
Owned For
Owner Type
Purchase Details
Closed on
Dec 29, 2005
Sold by
Ward Joshua M
Bought by
Wilmoth James A
Current Estimated Value
Home Financials for this Owner
Home Financials are based on the most recent Mortgage that was taken out on this home.
Original Mortgage
$78,655
Outstanding Balance
$44,000
Interest Rate
6.19%
Mortgage Type
VA
Estimated Equity
$129,467
Purchase Details
Closed on
Aug 27, 2003
Sold by
Lunceford George A and Lunceford April
Bought by
Ward Joshua M
Purchase Details
Closed on
Oct 16, 1996
Sold by
Lewis Gregory P and Lewis Melissa S
Bought by
Lunceford George A and Lunceford April M
Purchase Details
Closed on
Jun 17, 1994
Sold by
Wood Richard L
Bought by
Lewis Gregory P and Lewis Melissa S
Purchase Details
Closed on
Mar 24, 1994
Sold by
Wood Ana P
Bought by
Wood Richard L
Purchase Details
Closed on
Oct 6, 1972
Sold by
Wood Jacquelyn Ruth Etal
Bought by
Wood Ana P
Purchase Details
Closed on
May 16, 1961
Bought by
Wood Jack R and Wood Wife
Create a Home Valuation Report for This Property
The Home Valuation Report is an in-depth analysis detailing your home's value as well as a comparison with similar homes in the area
Home Values in the Area
Average Home Value in this Area
Purchase History
| Date | Buyer | Sale Price | Title Company |
|---|---|---|---|
| Wilmoth James A | $77,000 | None Available | |
| Ward Joshua M | $65,900 | -- | |
| Lunceford George A | $58,900 | -- | |
| Lewis Gregory P | $46,500 | -- | |
| Wood Richard L | -- | -- | |
| Wood Ana P | -- | -- | |
| Wood Jack R | -- | -- |
Source: Public Records
Mortgage History
| Date | Status | Borrower | Loan Amount |
|---|---|---|---|
| Open | Wilmoth James A | $78,655 |
Source: Public Records
Tax History
| Year | Tax Paid | Tax Assessment Tax Assessment Total Assessment is a certain percentage of the fair market value that is determined by local assessors to be the total taxable value of land and additions on the property. | Land | Improvement |
|---|---|---|---|---|
| 2024 | $1,198 | $38,000 | $4,640 | $33,360 |
| 2023 | $967 | $30,720 | $4,640 | $26,080 |
| 2022 | $612 | $28,600 | $4,640 | $23,960 |
| 2021 | $537 | $25,240 | $4,640 | $20,600 |
| 2020 | $537 | $25,120 | $4,640 | $20,480 |
| 2019 | $537 | $25,120 | $4,640 | $20,480 |
| 2018 | $537 | $25,120 | $4,640 | $20,480 |
| 2017 | $538 | $25,120 | $4,640 | $20,480 |
| 2016 | $538 | $25,120 | $4,640 | $20,480 |
| 2015 | -- | $25,120 | $4,640 | $20,480 |
| 2014 | -- | $25,920 | $4,640 | $21,280 |
| 2013 | -- | $25,920 | $4,640 | $21,280 |
Source: Public Records
Map
Nearby Homes
- 104 Jackson St
- 129 Lincoln St
- 126 Lincoln St
- 141 Wall St
- 201 Sherman St
- 103 Virginia Dare Dr
- 304 Wall St
- 108 Virginia Dare Dr
- 108 Smith Ct
- 206,208,210&212 Virginia Dare Dr
- 210 Scott Blvd
- 330 Hidden Creek Cir
- 908 Crestwood Terrace
- 207 Eaker Dr
- 106 Ida Ave
- 108 Ida Ave
- 509 S Pleasant Hill Rd
- 2013 Moody Rd
- 1312 Hartley Ave
- 301 Doyle St
Your Personal Tour Guide
Ask me questions while you tour the home.