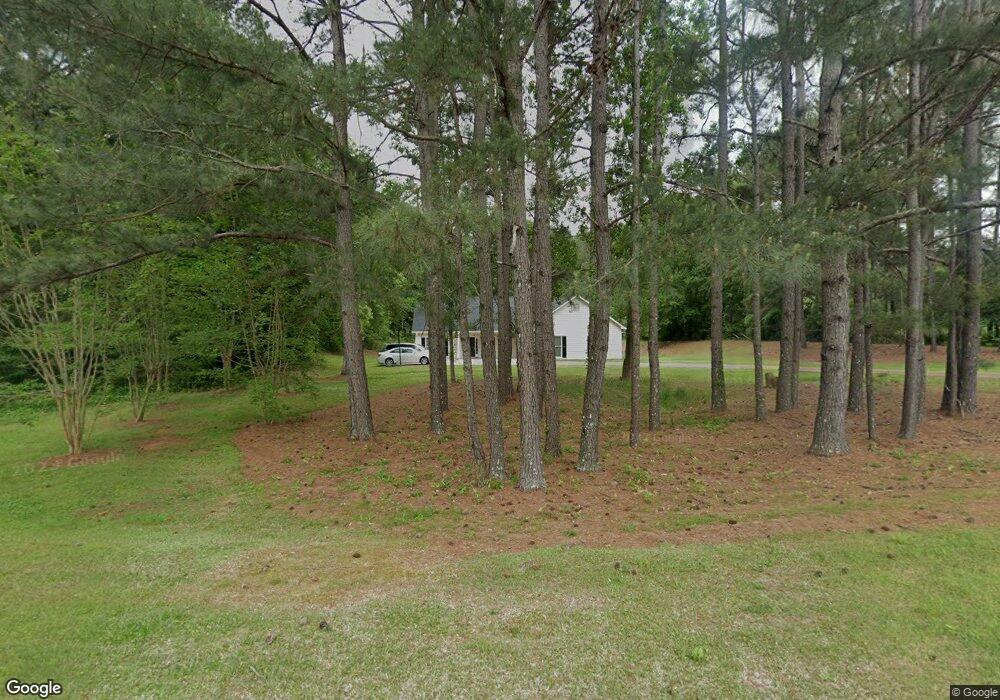
100 Sunny Point Cir Lagrange, GA 30240
Estimated Value: $444,000 - $522,414
4
Beds
5
Baths
4,536
Sq Ft
$107/Sq Ft
Est. Value
About This Home
This home is located at 100 Sunny Point Cir, Lagrange, GA 30240 and is currently estimated at $486,604, approximately $107 per square foot. 100 Sunny Point Cir is a home located in Troup County with nearby schools including Franklin Forest Elementary School, Hollis Hand Elementary School, and Ethel W. Kight Elementary School.
Ownership History
Date
Name
Owned For
Owner Type
Purchase Details
Closed on
Mar 24, 2003
Sold by
Melissa Michael and Melissa Doig
Bought by
Modi Hema A
Current Estimated Value
Purchase Details
Closed on
Sep 27, 2001
Sold by
Avula Jaiwant-K and Avula Dorothy E
Bought by
Melissa Michael and Melissa Doig
Purchase Details
Closed on
Sep 28, 1998
Sold by
Averett G Cody
Bought by
Avula Jaiwant-K and Avula Dorothy E
Purchase Details
Closed on
Jul 25, 1996
Sold by
Jerry C Averett
Bought by
Averett G Cody
Purchase Details
Closed on
Apr 10, 1995
Sold by
Davis O B
Bought by
Jerry C Averett
Purchase Details
Closed on
Apr 30, 1992
Sold by
Benjamin R Yates
Bought by
Davis O B
Purchase Details
Closed on
Apr 17, 1992
Sold by
Davis O B
Bought by
Benjamin R Yates
Purchase Details
Closed on
Dec 1, 1988
Sold by
O B and Virginia Davis
Bought by
Davis O B
Purchase Details
Closed on
Jan 1, 1964
Bought by
O B and Virginia Davis
Create a Home Valuation Report for This Property
The Home Valuation Report is an in-depth analysis detailing your home's value as well as a comparison with similar homes in the area
Home Values in the Area
Average Home Value in this Area
Purchase History
| Date | Buyer | Sale Price | Title Company |
|---|---|---|---|
| Modi Hema A | $165,000 | -- | |
| Melissa Michael | $160,000 | -- | |
| Avula Jaiwant-K | $158,000 | -- | |
| Averett G Cody | $65,000 | -- | |
| Jerry C Averett | $82,500 | -- | |
| Davis O B | -- | -- | |
| Benjamin R Yates | $30,800 | -- | |
| Davis O B | -- | -- | |
| O B | -- | -- |
Source: Public Records
Tax History Compared to Growth
Tax History
| Year | Tax Paid | Tax Assessment Tax Assessment Total Assessment is a certain percentage of the fair market value that is determined by local assessors to be the total taxable value of land and additions on the property. | Land | Improvement |
|---|---|---|---|---|
| 2024 | $3,838 | $142,720 | $18,264 | $124,456 |
| 2023 | $3,350 | $142,720 | $18,264 | $124,456 |
| 2022 | $3,615 | $154,720 | $19,800 | $134,920 |
| 2021 | $3,488 | $117,640 | $19,800 | $97,840 |
| 2020 | $3,488 | $117,640 | $19,800 | $97,840 |
| 2019 | $3,264 | $110,200 | $7,200 | $103,000 |
| 2018 | $3,264 | $110,200 | $7,200 | $103,000 |
| 2017 | $3,264 | $110,200 | $7,200 | $103,000 |
| 2016 | $3,235 | $109,260 | $7,200 | $102,060 |
| 2015 | $3,241 | $109,260 | $7,200 | $102,060 |
| 2014 | $3,183 | $107,155 | $7,200 | $99,955 |
| 2013 | -- | $107,685 | $7,200 | $100,485 |
Source: Public Records
Map
Nearby Homes
- 129 Sunny Point Cir
- 117 Woodchase
- 105 Ridgeview Dr
- 118 Moss Creek Dr
- 107 Windridge
- 109 Windridge
- 104 Hidden Branches Ln
- LOT 106 River Oaks Dr
- 209 River Oaks Dr
- 127 Oakmont Dr
- 127 Ashling Dr
- 91 Richmond Dr
- 106 Highland Park
- 1784 New Franklin Rd
- 100 Creekside Dr Unit LOT 60A
- 107 Dixie Creek Dr
- 219 E Yorktown Dr
- 3011 Mooty Bridge Rd
- 203 S Chilton Crescent
- 201 S Chilton Crescent
- 110 Sunny Point Dr
- 102 Sunny Point Cir
- 2150 Mooty Bridge Rd
- 142 Sunny Point Cir
- 207 Sunny Point Cir
- 101 Pond View Point
- 101 Pond View Point Unit Lot 1
- 104 Sunny Point Cir
- 2178 Mooty Bridge Rd
- 105 Sunny Point Cir
- 104 Pond View Point
- 103 Pond View Point
- 140 Sunny Point Cir
- 2191 Mooty Bridge Rd
- 2188 Mooty Bridge Rd
- 106 Sunny Point Cir Unit 4
- 106 Sunny Point Cir
- 105 Pond View Point
- 106 Pond View Point
- 138 Sunny Point Cir Unit 20