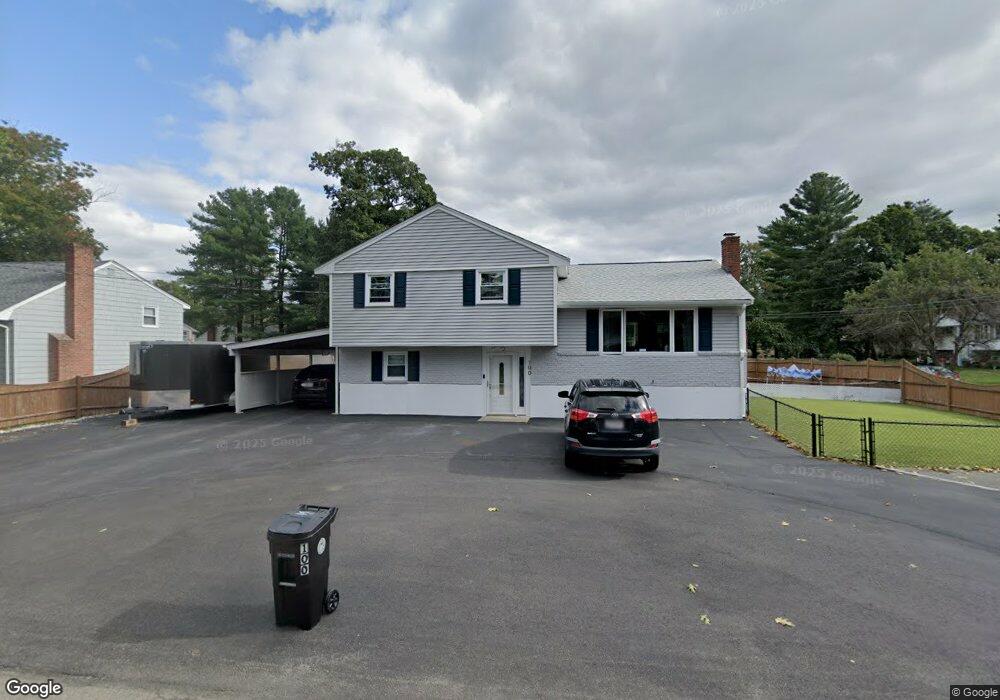
100 Taft Ave Brockton, MA 02301
Estimated Value: $504,000 - $592,000
3
Beds
2
Baths
1,552
Sq Ft
$349/Sq Ft
Est. Value
About This Home
This home is located at 100 Taft Ave, Brockton, MA 02301 and is currently estimated at $542,012, approximately $349 per square foot. 100 Taft Ave is a home located in Plymouth County with nearby schools including Hancock Elementary School, Manthala George Jr. School, and Louis F Angelo Elementary School.
Ownership History
Date
Name
Owned For
Owner Type
Purchase Details
Closed on
Apr 4, 2003
Sold by
Felton Dolores
Bought by
Harvey Lajuane and Harvey Paula A
Current Estimated Value
Home Financials for this Owner
Home Financials are based on the most recent Mortgage that was taken out on this home.
Original Mortgage
$214,650
Outstanding Balance
$93,092
Interest Rate
5.88%
Mortgage Type
Purchase Money Mortgage
Estimated Equity
$448,920
Purchase Details
Closed on
Nov 12, 1991
Sold by
Gillis Edward J and Gillis Diane G
Bought by
Felton Dolores
Home Financials for this Owner
Home Financials are based on the most recent Mortgage that was taken out on this home.
Original Mortgage
$103,900
Interest Rate
8.85%
Mortgage Type
Purchase Money Mortgage
Create a Home Valuation Report for This Property
The Home Valuation Report is an in-depth analysis detailing your home's value as well as a comparison with similar homes in the area
Home Values in the Area
Average Home Value in this Area
Purchase History
| Date | Buyer | Sale Price | Title Company |
|---|---|---|---|
| Harvey Lajuane | $238,500 | -- | |
| Felton Dolores | $129,900 | -- |
Source: Public Records
Mortgage History
| Date | Status | Borrower | Loan Amount |
|---|---|---|---|
| Open | Felton Dolores | $19,000 | |
| Open | Felton Dolores | $214,650 | |
| Previous Owner | Felton Dolores | $103,900 |
Source: Public Records
Tax History Compared to Growth
Tax History
| Year | Tax Paid | Tax Assessment Tax Assessment Total Assessment is a certain percentage of the fair market value that is determined by local assessors to be the total taxable value of land and additions on the property. | Land | Improvement |
|---|---|---|---|---|
| 2025 | $6,059 | $500,300 | $145,200 | $355,100 |
| 2024 | $5,855 | $487,100 | $145,200 | $341,900 |
| 2023 | $5,391 | $415,300 | $110,200 | $305,100 |
| 2022 | $5,081 | $363,700 | $100,200 | $263,500 |
| 2021 | $4,744 | $327,200 | $95,100 | $232,100 |
| 2020 | $4,834 | $319,100 | $91,100 | $228,000 |
| 2019 | $5,211 | $335,300 | $85,600 | $249,700 |
| 2018 | $4,513 | $281,000 | $85,600 | $195,400 |
| 2017 | $4,027 | $250,100 | $85,600 | $164,500 |
| 2016 | $3,993 | $230,000 | $81,600 | $148,400 |
| 2015 | $3,929 | $216,500 | $81,600 | $134,900 |
| 2014 | $3,699 | $204,000 | $81,600 | $122,400 |
Source: Public Records
Map
Nearby Homes