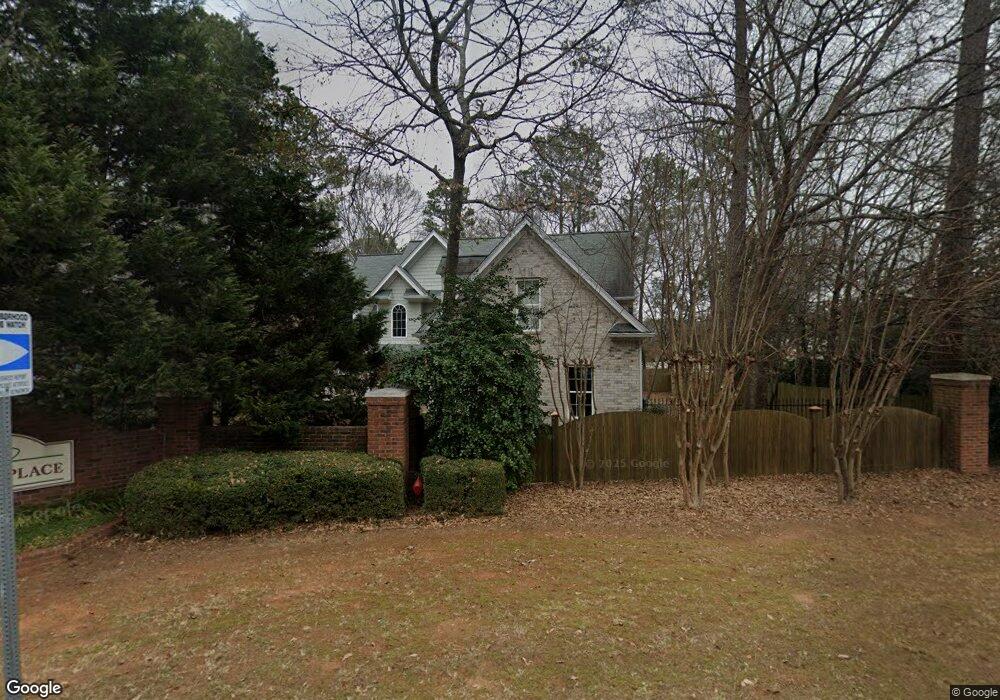
100 Telfair Place Athens, GA 30606
Oak Bend NeighborhoodEstimated Value: $562,374 - $654,000
4
Beds
4
Baths
2,965
Sq Ft
$206/Sq Ft
Est. Value
About This Home
This home is located at 100 Telfair Place, Athens, GA 30606 and is currently estimated at $610,594, approximately $205 per square foot. 100 Telfair Place is a home located in Clarke County with nearby schools including Timothy Elementary School, Clarke Middle School, and Clarke Central High School.
Ownership History
Date
Name
Owned For
Owner Type
Purchase Details
Closed on
Feb 5, 2020
Sold by
Allgood James L
Bought by
Seagraves Robert B and Seagraves Kathleen G
Current Estimated Value
Purchase Details
Closed on
Aug 27, 2008
Sold by
Gibbs Mitchell
Bought by
Allgood James L
Home Financials for this Owner
Home Financials are based on the most recent Mortgage that was taken out on this home.
Original Mortgage
$275,400
Interest Rate
6.48%
Mortgage Type
New Conventional
Purchase Details
Closed on
May 11, 2005
Sold by
K Carpenter Builder Inc
Bought by
Gibbs Mitchell and Gibbs Amelia W
Home Financials for this Owner
Home Financials are based on the most recent Mortgage that was taken out on this home.
Original Mortgage
$212,000
Interest Rate
5.8%
Mortgage Type
New Conventional
Purchase Details
Closed on
Jun 4, 2004
Sold by
Ajax Properties Inc
Bought by
K Carpenter Builder Inc
Create a Home Valuation Report for This Property
The Home Valuation Report is an in-depth analysis detailing your home's value as well as a comparison with similar homes in the area
Home Values in the Area
Average Home Value in this Area
Purchase History
| Date | Buyer | Sale Price | Title Company |
|---|---|---|---|
| Seagraves Robert B | $355,000 | -- | |
| Allgood James L | $285,000 | -- | |
| Gibbs Mitchell | $265,000 | -- | |
| K Carpenter Builder Inc | $30,000 | -- |
Source: Public Records
Mortgage History
| Date | Status | Borrower | Loan Amount |
|---|---|---|---|
| Previous Owner | Allgood James L | $275,400 | |
| Previous Owner | Gibbs Mitchell | $212,000 |
Source: Public Records
Tax History Compared to Growth
Tax History
| Year | Tax Paid | Tax Assessment Tax Assessment Total Assessment is a certain percentage of the fair market value that is determined by local assessors to be the total taxable value of land and additions on the property. | Land | Improvement |
|---|---|---|---|---|
| 2025 | $4,595 | $219,791 | $20,000 | $199,791 |
| 2024 | $4,595 | $204,858 | $20,000 | $184,858 |
| 2023 | $4,631 | $194,252 | $20,000 | $174,252 |
| 2022 | $4,388 | $162,398 | $20,000 | $142,398 |
| 2021 | $4,346 | $141,500 | $20,000 | $121,500 |
| 2020 | $4,624 | $137,219 | $20,000 | $117,219 |
| 2019 | $4,643 | $136,761 | $20,000 | $116,761 |
| 2018 | $4,543 | $133,827 | $20,000 | $113,827 |
| 2017 | $4,312 | $127,001 | $15,000 | $112,001 |
| 2016 | $3,878 | $114,224 | $15,000 | $99,224 |
| 2015 | $3,679 | $108,220 | $15,000 | $93,220 |
| 2014 | $3,851 | $113,110 | $15,000 | $98,110 |
Source: Public Records
Map
Nearby Homes
- 461 Oglethorpe Ave
- 1845 Olympus Ct
- 1847 Olympus Ct
- 1842 Olympus Ct
- 101 Wood Lake Dr Unit 307
- 114 Telfair Place
- 136 Timothy Park Ln
- 125 Wood Lake Dr Unit 210
- 137 Timothy Park Ln
- 190 Kirkwood Dr
- 245 Mallard Pointe Way
- 158 Mallard Pointe Way
- 292 Wood Lake Dr
- 140 Cypress Manor Ln
- 1771 Timothy Rd
- 232 Epps Bridge Rd Unit 1A
- 107 Tamara Ct
- 448 Epps Bridge Pkwy
- 102 Telfair Place
- 105 Telfair Ct
- 104 Telfair Place
- 110 Telfair Ct
- 426 Epps Bridge Pkwy
- 309 &313 Providence Rd
- 1174 Traveller Run Unit LOT 2
- 1813 Parthenon Dr
- 1360 Olympus Ct
- 1503 Olympus Ct
- 188 Ben Burton Cir Unit 300
- 1887 Brady Way (Lot 4b)
- 2452 Downs Creek Drive (Lot 4b)
- 0 Daniels Bridge Rd Unit 948511
- 0000 Daniels Bridge Rd
- 1174 Traveller Run
- Tract 2 Lumpkin St S
- 630 Bowles Dr
- 190 St James Dr