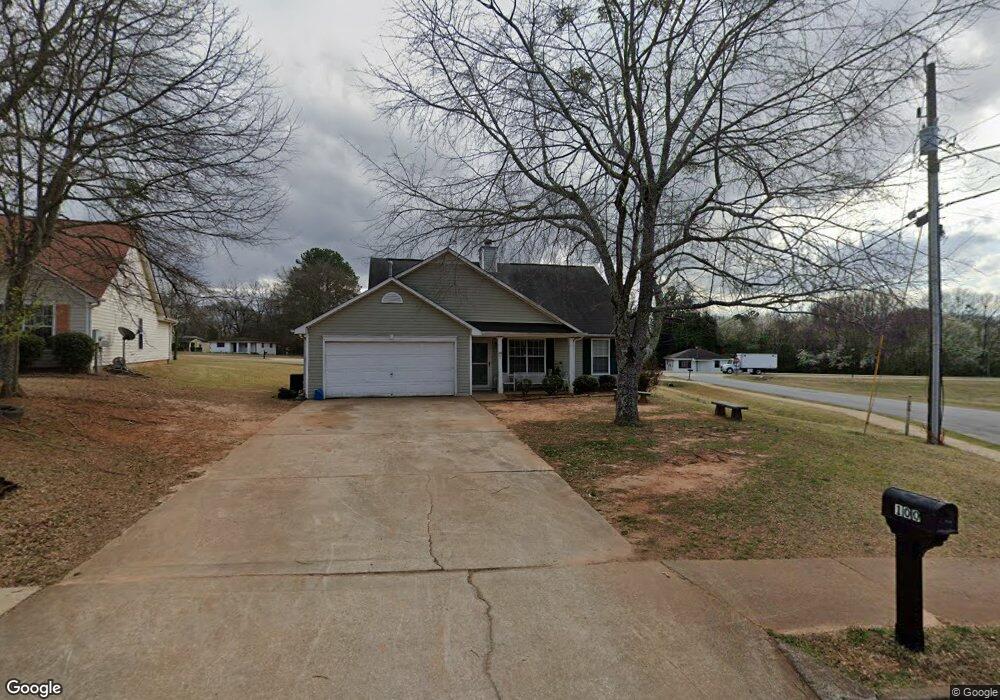
100 Tillman Ct McDonough, GA 30253
Estimated Value: $218,000 - $228,470
3
Beds
2
Baths
1,223
Sq Ft
$182/Sq Ft
Est. Value
About This Home
This home is located at 100 Tillman Ct, McDonough, GA 30253 and is currently estimated at $222,618, approximately $182 per square foot. 100 Tillman Ct is a home located in Henry County with nearby schools including Tussahaw Elementary School, McDonough Middle School, and McDonough Methodist Academy.
Ownership History
Date
Name
Owned For
Owner Type
Purchase Details
Closed on
Sep 28, 2020
Sold by
Bell Robert A
Bought by
Bell Jerrell Oliver and Bell Robert A
Current Estimated Value
Purchase Details
Closed on
May 25, 2000
Sold by
Tim Jones Communities Inc
Bought by
Bell Norma J
Home Financials for this Owner
Home Financials are based on the most recent Mortgage that was taken out on this home.
Original Mortgage
$85,200
Outstanding Balance
$29,370
Interest Rate
8.11%
Mortgage Type
New Conventional
Estimated Equity
$193,248
Create a Home Valuation Report for This Property
The Home Valuation Report is an in-depth analysis detailing your home's value as well as a comparison with similar homes in the area
Home Values in the Area
Average Home Value in this Area
Purchase History
| Date | Buyer | Sale Price | Title Company |
|---|---|---|---|
| Bell Jerrell Oliver | -- | -- | |
| Bell Norma J | $89,700 | -- |
Source: Public Records
Mortgage History
| Date | Status | Borrower | Loan Amount |
|---|---|---|---|
| Open | Bell Norma J | $85,200 |
Source: Public Records
Tax History Compared to Growth
Tax History
| Year | Tax Paid | Tax Assessment Tax Assessment Total Assessment is a certain percentage of the fair market value that is determined by local assessors to be the total taxable value of land and additions on the property. | Land | Improvement |
|---|---|---|---|---|
| 2024 | $2,868 | $91,920 | $12,000 | $79,920 |
| 2023 | $2,375 | $96,760 | $11,200 | $85,560 |
| 2022 | $2,175 | $67,200 | $10,000 | $57,200 |
| 2021 | $1,810 | $52,120 | $10,000 | $42,120 |
| 2020 | $571 | $49,880 | $8,000 | $41,880 |
| 2019 | $600 | $48,600 | $8,000 | $40,600 |
| 2018 | $475 | $37,840 | $8,000 | $29,840 |
| 2016 | $436 | $34,520 | $6,000 | $28,520 |
| 2015 | $384 | $29,680 | $6,000 | $23,680 |
| 2014 | $264 | $24,000 | $6,000 | $18,000 |
Source: Public Records
Map
Nearby Homes
- 117 Tillman Ct
- 34 Cherry St
- 38 Head St
- 61 Cherry St
- 133 Fairview Rd
- 58 Washington St
- 309 Navigator Ln
- 313 Navigator Ln
- Annalise Plan at Avery Landing
- Dallas Plan at Avery Landing
- Braden Plan at Avery Landing
- 317 Navigator Ln
- 329 Navigator Ln
- 357 Navigator Ln
- 349 Navigator Ln
- 329 Hampton St
- 301 Navigator Ln
- 104 Tillman Ct
- 200 Head Ln
- 108 Tillman Ct
- 254 Phillips Dr
- 101 Tillman Ct
- 208 Phillips Dr
- 113 Tillman Ct
- 200 Talbot Ct
- 233 Phillips Dr
- 245 Phillips Dr
- 250 Head Ln
- 213 Phillips Dr
- 210 Talbot Ct
- 115 Tillman Ct
- 0 Talbot Ct Unit 7047049
- 0 Talbot Ct Unit 8259492
- 0 Talbot Ct Unit 3210665
- 0 Talbot Ct
- 198 Phillips Dr
- 278 Phillips Dr