Estimated Value: $326,000 - $448,000
4
Beds
2
Baths
2,014
Sq Ft
$185/Sq Ft
Est. Value
About This Home
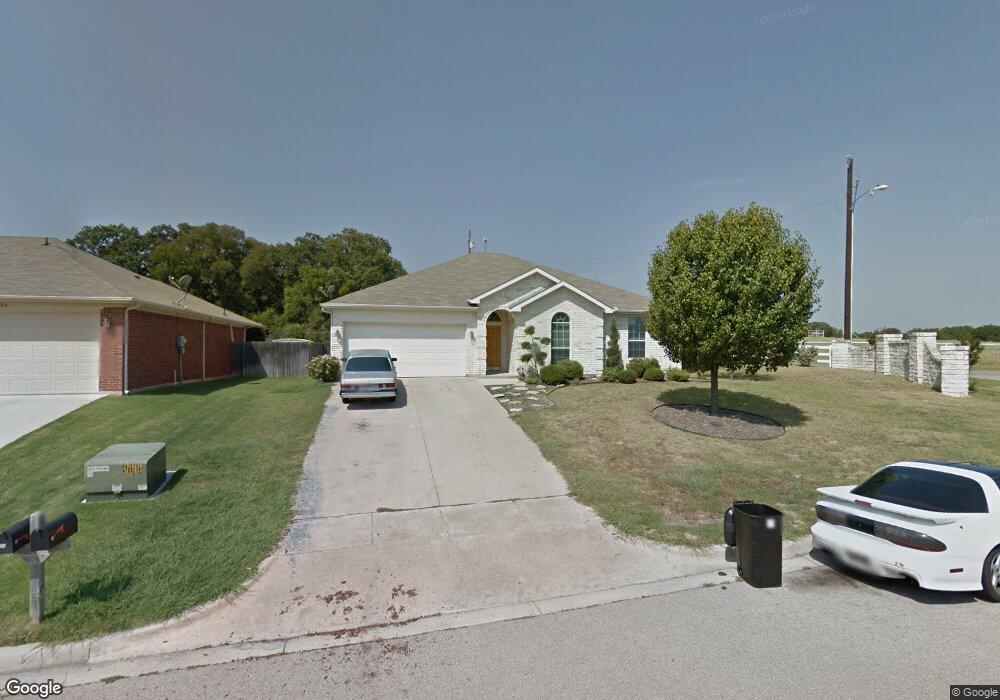
This home is located at 100 Timber Cross Ct, Azle, TX 76020 and is currently estimated at $372,728, approximately $185 per square foot. 100 Timber Cross Ct is a home located in Parker County with nearby schools including Azle Elementary School, Azle Junior High School, and Azle High School.
Ownership History
Date
Name
Owned For
Owner Type
Purchase Details
Closed on
Dec 22, 2011
Sold by
Long Terry L and Long Billie M
Bought by
Samudio Dimitrius and Samudio Donna
Current Estimated Value
Home Financials for this Owner
Home Financials are based on the most recent Mortgage that was taken out on this home.
Original Mortgage
$144,443
Outstanding Balance
$98,142
Interest Rate
3.87%
Mortgage Type
FHA
Estimated Equity
$274,586
Purchase Details
Closed on
Sep 22, 2003
Sold by
Choice Homes Inc
Bought by
Samudio Dimitrius and Samudio Donna
Purchase Details
Closed on
Jun 24, 2003
Sold by
Profit Shar Pl & Tr For Employ
Bought by
Samudio Dimitrius and Samudio Donna
Purchase Details
Closed on
Mar 25, 2003
Sold by
Greenhaw F P Iii Inc Pension P
Bought by
Samudio Dimitrius and Samudio Donna
Create a Home Valuation Report for This Property
The Home Valuation Report is an in-depth analysis detailing your home's value as well as a comparison with similar homes in the area
Home Values in the Area
Average Home Value in this Area
Purchase History
| Date | Buyer | Sale Price | Title Company |
|---|---|---|---|
| Samudio Dimitrius | -- | Fnt | |
| Samudio Dimitrius | -- | -- | |
| Samudio Dimitrius | -- | -- | |
| Samudio Dimitrius | -- | -- |
Source: Public Records
Mortgage History
| Date | Status | Borrower | Loan Amount |
|---|---|---|---|
| Open | Samudio Dimitrius | $144,443 |
Source: Public Records
Tax History Compared to Growth
Tax History
| Year | Tax Paid | Tax Assessment Tax Assessment Total Assessment is a certain percentage of the fair market value that is determined by local assessors to be the total taxable value of land and additions on the property. | Land | Improvement |
|---|---|---|---|---|
| 2025 | $1,169 | $297,079 | -- | -- |
| 2024 | $1,169 | $270,072 | -- | -- |
| 2023 | $1,169 | $245,520 | $0 | $0 |
| 2022 | $5,298 | $223,200 | $36,000 | $187,200 |
| 2021 | $5,571 | $223,200 | $36,000 | $187,200 |
| 2020 | $5,225 | $210,200 | $23,000 | $187,200 |
| 2019 | $5,302 | $210,200 | $23,000 | $187,200 |
| 2018 | $4,840 | $186,040 | $23,000 | $163,040 |
| 2017 | $4,251 | $186,040 | $23,000 | $163,040 |
| 2016 | $3,865 | $152,560 | $23,000 | $129,560 |
| 2015 | $945 | $152,560 | $23,000 | $129,560 |
| 2014 | $3,571 | $149,210 | $23,000 | $126,210 |
Source: Public Records
Map
Nearby Homes
- 1550 S Stewart St
- 616 Cameron Way
- 595 Flat Rock Rd
- 237 Gardenia Dr
- 140 Huling Dr
- 213 Rosemary Dr
- 6021 Piper Anne St
- 424 Amory St
- 255 Baughman Hill Rd
- 1055 Meadow Wood Terrace
- 405 Glade Crest Rd
- TBD 2 Flat Rock Rd
- TBD Flat Rock Rd
- 13449 S Fm 730
- Lot 143 Blk 4 Veal Station Rd
- 4024 Olivia Lucille St
- 209 Churchill Ct
- 181 Churchill Cir
- 2001 Forest Bridge Dr
- 1600 Flat Rock Rd
- 104 Timber Cross Ct
- 108 Timber Cross Ct
- 1357 S Stewart St
- 112 Timber Cross Ct
- 116 Timber Cross Ct
- 120 Timber Cross Ct
- 0 Timber Cross Ct Unit 13166473
- 124 Timber Cross Ct
- 1350 S Stewart St
- 1401 S Stewart St
- 1202 S Stewart St
- 133 Timber Cross Ct
- 1460 S Stewart St
- 1461 S Stewart St
- 1501 S Stewart St
- 101 Timber Cross Ct
- 105 Timber Cross Ct
- 109 Timber Cross Ct
- 113 Timber Cross Ct
- 1551 S Stewart St