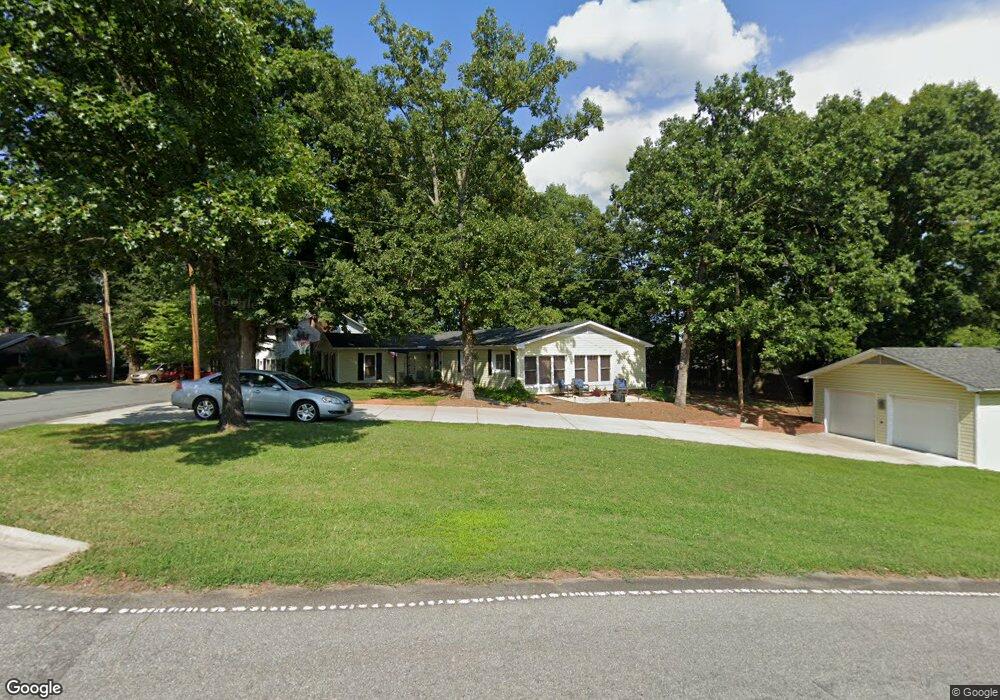
100 Todd Dr NE Concord, NC 28025
Estimated Value: $340,000 - $395,000
4
Beds
3
Baths
2,128
Sq Ft
$172/Sq Ft
Est. Value
About This Home
This home is located at 100 Todd Dr NE, Concord, NC 28025 and is currently estimated at $366,062, approximately $172 per square foot. 100 Todd Dr NE is a home located in Cabarrus County with nearby schools including Beverly Hills STEM Elementary, Concord Middle School, and Concord High School.
Ownership History
Date
Name
Owned For
Owner Type
Purchase Details
Closed on
Jun 25, 2015
Sold by
Drye Arthur M and Drye Pauline W
Bought by
Parker Donald and Parker Mary
Current Estimated Value
Home Financials for this Owner
Home Financials are based on the most recent Mortgage that was taken out on this home.
Original Mortgage
$159,300
Outstanding Balance
$125,543
Interest Rate
4.25%
Mortgage Type
Adjustable Rate Mortgage/ARM
Estimated Equity
$240,519
Purchase Details
Closed on
Apr 30, 2007
Sold by
Smith Steven E and Smith Ida T
Bought by
Drye Arthur M and Drye Pauline W
Home Financials for this Owner
Home Financials are based on the most recent Mortgage that was taken out on this home.
Original Mortgage
$130,700
Interest Rate
6.1%
Mortgage Type
Purchase Money Mortgage
Purchase Details
Closed on
Oct 19, 2006
Sold by
Stalter Maynard R and Stalter Penelope
Bought by
Smith Steve
Purchase Details
Closed on
Jun 30, 1999
Sold by
Cook Paul B and Cook Frances S
Bought by
Stalter Maynard R and Stalter Penelope
Home Financials for this Owner
Home Financials are based on the most recent Mortgage that was taken out on this home.
Original Mortgage
$88,550
Interest Rate
7.27%
Create a Home Valuation Report for This Property
The Home Valuation Report is an in-depth analysis detailing your home's value as well as a comparison with similar homes in the area
Home Values in the Area
Average Home Value in this Area
Purchase History
| Date | Buyer | Sale Price | Title Company |
|---|---|---|---|
| Parker Donald | $157,500 | None Available | |
| Drye Arthur M | $183,000 | None Available | |
| Smith Steve | $102,000 | None Available | |
| Stalter Maynard R | $126,500 | -- |
Source: Public Records
Mortgage History
| Date | Status | Borrower | Loan Amount |
|---|---|---|---|
| Open | Parker Donald | $159,300 | |
| Previous Owner | Drye Arthur M | $130,700 | |
| Previous Owner | Stalter Maynard R | $88,550 |
Source: Public Records
Tax History Compared to Growth
Tax History
| Year | Tax Paid | Tax Assessment Tax Assessment Total Assessment is a certain percentage of the fair market value that is determined by local assessors to be the total taxable value of land and additions on the property. | Land | Improvement |
|---|---|---|---|---|
| 2025 | $3,106 | $311,860 | $126,500 | $185,360 |
| 2024 | $3,106 | $311,860 | $126,500 | $185,360 |
| 2023 | $2,341 | $191,920 | $64,400 | $127,520 |
| 2022 | $2,341 | $191,920 | $64,400 | $127,520 |
| 2021 | $2,341 | $191,920 | $64,400 | $127,520 |
| 2020 | $2,341 | $191,920 | $64,400 | $127,520 |
| 2019 | $1,928 | $158,020 | $41,400 | $116,620 |
| 2018 | $1,896 | $158,020 | $41,400 | $116,620 |
| 2017 | $1,865 | $158,020 | $41,400 | $116,620 |
| 2016 | $1,106 | $165,670 | $41,400 | $124,270 |
| 2015 | $1,955 | $165,670 | $41,400 | $124,270 |
| 2014 | $1,955 | $165,670 | $41,400 | $124,270 |
Source: Public Records
Map
Nearby Homes
- 606 Camrose Cir NE
- 629 Camrose Cir NE Unit 45
- 649 Camrose Cir NE
- 653 Camrose Cir NE
- 138 Tetbury Ave NE
- 19 Todd Dr NE
- 147 Madison Ave NE
- 159 Madison Ave NE
- 457 Birchwood Trail NE
- 333 Hillandale St NE
- 336 Hamilton Dr NE
- 63 Brookwood Ave NW
- 1 Buffalo Ave NW Unit 81
- 59 Mckinnon Ave NE
- 148 Palaside Dr NE
- 636 Forest St NW
- 642 Forest St NW
- 722 Wilmar St NW
- 80 Lecline Cir NE
- 635 Windsor Place NE
- 104 Todd Dr NE
- 88 Todd Dr NE
- 584 Camrose Cir NE Unit 6
- 95 Todd Dr NE
- 95 Carolina Ave NE
- 582 Camrose Cir NE
- 125 Carolina Ct NE
- 129 Carolina Ct NE
- 91 Carolina Ave NE
- 121 Carolina Ct NE
- 580 Camrose Cir NE
- 578 Camrose Cir NE
- 105 Carolina Ct NE
- 494 Todd Dr NE
- 576 Camrose Cir NE
- 574 Camrose Cir NE
- 493 Hillandale St NE
- 80 Todd Dr NE
- 501 Todd Dr NE Unit lot 9/137
- 501 Todd Dr NE