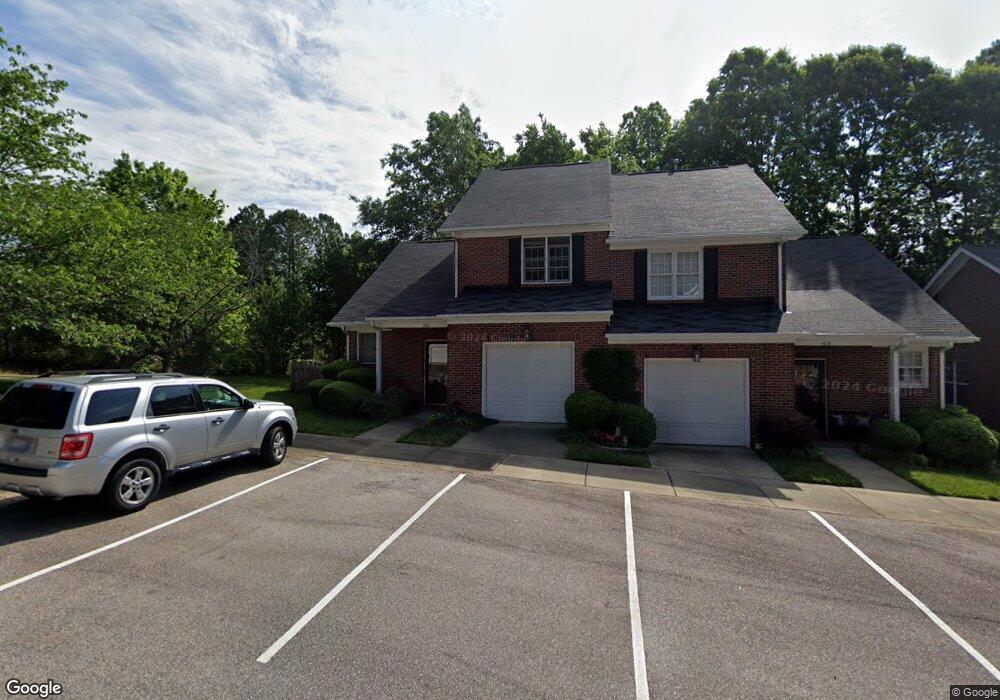
100 Tuska Hills Dr Holly Springs, NC 27540
Estimated Value: $314,000 - $355,000
3
Beds
3
Baths
1,397
Sq Ft
$242/Sq Ft
Est. Value
About This Home
This home is located at 100 Tuska Hills Dr, Holly Springs, NC 27540 and is currently estimated at $337,618, approximately $241 per square foot. 100 Tuska Hills Dr is a home located in Wake County with nearby schools including Oakview Elementary School, Apex Friendship Middle School, and Holly Springs High School.
Ownership History
Date
Name
Owned For
Owner Type
Purchase Details
Closed on
Sep 22, 2017
Sold by
Kirby Trena M and Powell Rodney
Bought by
Nichols Taylor M
Current Estimated Value
Home Financials for this Owner
Home Financials are based on the most recent Mortgage that was taken out on this home.
Original Mortgage
$193,939
Outstanding Balance
$161,778
Interest Rate
3.86%
Mortgage Type
New Conventional
Estimated Equity
$175,840
Purchase Details
Closed on
Jun 29, 2007
Sold by
Joey Ferrell Inc
Bought by
Kirby Trena M
Home Financials for this Owner
Home Financials are based on the most recent Mortgage that was taken out on this home.
Original Mortgage
$139,200
Interest Rate
6.37%
Mortgage Type
Unknown
Purchase Details
Closed on
Feb 5, 2007
Sold by
Sol Inc
Bought by
Joey Ferrell Inc
Create a Home Valuation Report for This Property
The Home Valuation Report is an in-depth analysis detailing your home's value as well as a comparison with similar homes in the area
Home Values in the Area
Average Home Value in this Area
Purchase History
| Date | Buyer | Sale Price | Title Company |
|---|---|---|---|
| Nichols Taylor M | $192,000 | None Available | |
| Kirby Trena M | $174,000 | None Available | |
| Joey Ferrell Inc | $70,000 | None Available |
Source: Public Records
Mortgage History
| Date | Status | Borrower | Loan Amount |
|---|---|---|---|
| Open | Nichols Taylor M | $193,939 | |
| Previous Owner | Kirby Trena M | $139,200 | |
| Previous Owner | Kirby Trena M | $34,800 |
Source: Public Records
Tax History Compared to Growth
Tax History
| Year | Tax Paid | Tax Assessment Tax Assessment Total Assessment is a certain percentage of the fair market value that is determined by local assessors to be the total taxable value of land and additions on the property. | Land | Improvement |
|---|---|---|---|---|
| 2025 | $2,712 | $312,849 | $70,000 | $242,849 |
| 2024 | $2,701 | $312,849 | $70,000 | $242,849 |
| 2023 | $2,061 | $189,189 | $35,000 | $154,189 |
| 2022 | $1,990 | $189,189 | $35,000 | $154,189 |
| 2021 | $1,953 | $189,189 | $35,000 | $154,189 |
| 2020 | $1,953 | $189,189 | $35,000 | $154,189 |
| 2019 | $2,013 | $165,641 | $35,000 | $130,641 |
| 2018 | $1,820 | $165,641 | $35,000 | $130,641 |
| 2017 | $1,755 | $165,641 | $35,000 | $130,641 |
| 2016 | $1,731 | $165,641 | $35,000 | $130,641 |
| 2015 | $1,717 | $161,702 | $36,000 | $125,702 |
| 2014 | $1,658 | $161,702 | $36,000 | $125,702 |
Source: Public Records
Map
Nearby Homes
- 761 W Holly Springs Rd
- 755 W Holly Springs Rd
- 749 W Holly Springs Rd
- 743 W Holly Springs Rd
- 737 W Holly Springs Rd
- 936 W Holly Springs Rd
- 224 Hartshorn Ct
- 920 W Holly Springs Rd
- 321 Cross Hill Ln
- 225 Douglas St
- 124 Cliffdale Rd
- 105 Cross Hill Ln
- 112 Burt St
- 104 Chilmark Ridge Dr
- 105 Townsgate Ct
- 321 Blalock St
- 713 Littleleaf Ct
- 720 Starkland Way
- 100 Sire Ct
- 109 Bright Shade Ct
- 102 Tuska Hills Dr
- 104 Tuska Hills Dr
- 106 Tuska Hills Dr
- 229 Saranac Ridge Dr
- 108 Tuska Hills Dr
- 225 Saranac Ridge Dr
- 105 Tuska Hills Dr
- 103 Tuska Hills Dr
- 107 Tuska Hills Dr
- 109 Tuska Hills Dr
- 110 Tuska Hills Dr
- 301 Saranac Ridge Dr
- 111 Tuska Hills Dr
- 221 Saranac Ridge Dr
- 112 Tuska Hills Dr
- 114 Tuska Hills Dr
- 305 Saranac Ridge Dr
- 217 Saranac Ridge Dr
- 116 Tuska Hills Dr
- 118 Tuska Hills Dr