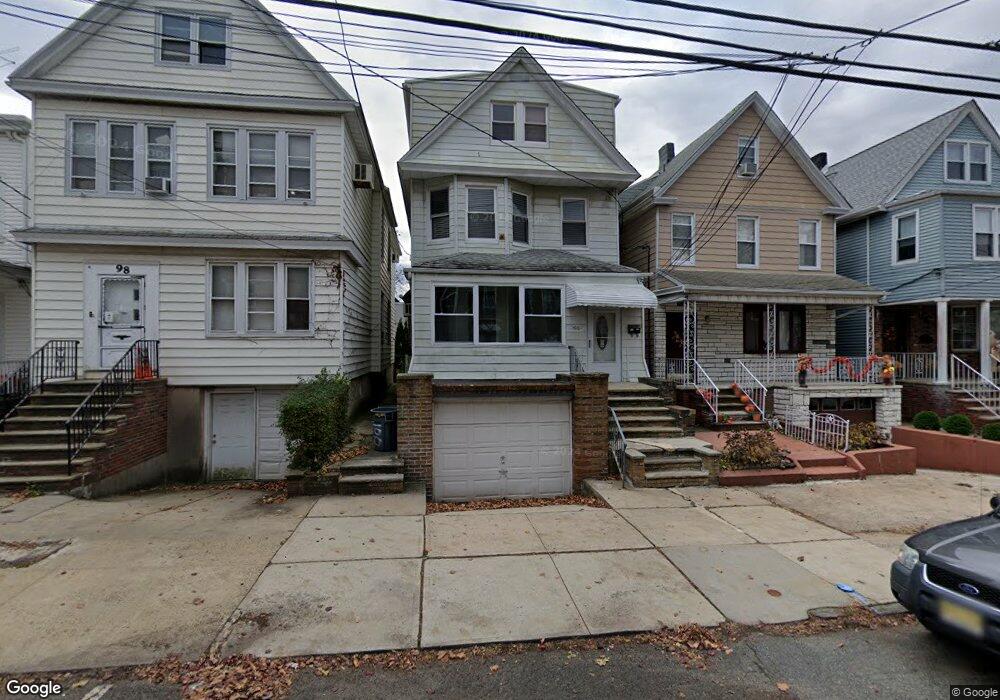
100 W 45th St Unit 3 Bayonne, NJ 07002
North Bayonne NeighborhoodEstimated Value: $646,000 - $803,926
2
Beds
1
Bath
2,376
Sq Ft
$312/Sq Ft
Est. Value
About This Home
This home is located at 100 W 45th St Unit 3, Bayonne, NJ 07002 and is currently estimated at $740,232, approximately $311 per square foot. 100 W 45th St Unit 3 is a home located in Hudson County with nearby schools including Bayonne High School and Yeshiva Gedolah of Bayonne.
Ownership History
Date
Name
Owned For
Owner Type
Purchase Details
Closed on
Sep 24, 2024
Sold by
Garcia Kris Fatima L Bello and Garcia Josefina Bello
Bought by
Villanueva Darisleydis Garcia
Current Estimated Value
Home Financials for this Owner
Home Financials are based on the most recent Mortgage that was taken out on this home.
Original Mortgage
$736,415
Outstanding Balance
$728,284
Interest Rate
6.09%
Mortgage Type
FHA
Estimated Equity
$11,948
Purchase Details
Closed on
Sep 16, 2016
Sold by
Calencia Mario and Valencia Christine
Bought by
Garcia Josefina Bello
Home Financials for this Owner
Home Financials are based on the most recent Mortgage that was taken out on this home.
Original Mortgage
$395,700
Interest Rate
4.25%
Mortgage Type
FHA
Create a Home Valuation Report for This Property
The Home Valuation Report is an in-depth analysis detailing your home's value as well as a comparison with similar homes in the area
Home Values in the Area
Average Home Value in this Area
Purchase History
| Date | Buyer | Sale Price | Title Company |
|---|---|---|---|
| Villanueva Darisleydis Garcia | $750,000 | Prestige Title | |
| Villanueva Darisleydis Garcia | $750,000 | Prestige Title | |
| Garcia Josefina Bello | $403,000 | Fidelity Nat Title Ins Co |
Source: Public Records
Mortgage History
| Date | Status | Borrower | Loan Amount |
|---|---|---|---|
| Open | Villanueva Darisleydis Garcia | $736,415 | |
| Closed | Villanueva Darisleydis Garcia | $736,415 | |
| Previous Owner | Garcia Josefina Bello | $395,700 |
Source: Public Records
Tax History Compared to Growth
Tax History
| Year | Tax Paid | Tax Assessment Tax Assessment Total Assessment is a certain percentage of the fair market value that is determined by local assessors to be the total taxable value of land and additions on the property. | Land | Improvement |
|---|---|---|---|---|
| 2025 | $10,790 | $426,100 | $180,000 | $246,100 |
| 2024 | $10,354 | $385,900 | $180,000 | $205,900 |
| 2023 | $10,354 | $385,900 | $180,000 | $205,900 |
| 2022 | $10,161 | $385,900 | $180,000 | $205,900 |
| 2021 | $10,080 | $385,900 | $180,000 | $205,900 |
| 2020 | $9,902 | $385,900 | $180,000 | $205,900 |
| 2019 | $11,564 | $134,000 | $62,500 | $71,500 |
| 2018 | $11,334 | $134,000 | $62,500 | $71,500 |
| 2017 | $11,040 | $134,000 | $62,500 | $71,500 |
| 2016 | $10,633 | $134,000 | $62,500 | $71,500 |
| 2015 | $10,283 | $134,000 | $62,500 | $71,500 |
| 2014 | $11,004 | $147,800 | $62,500 | $85,300 |
Source: Public Records
Map
Nearby Homes
- 121 W 44th St
- 176 Avenue B
- 83 W 42nd St
- 79 W 48th St
- 67 W 48th St Unit 234
- 98 W 49th St
- 1011 Avenue C Unit B326
- 10 W 46th St
- 17 W 42nd St
- 51 W 48th St
- 69 W 39th St
- 39 W 40th St
- 46 W 40th St
- 233 Avenue B
- 122 W 39th St Unit A4
- 99 W 50th St
- 10 E 45th St
- 20 W 49th St Unit 1 & 2
- 20 W 49th St
- 187 W 48th St
- 100 W 45th St Unit 2
- 100 W 45th St
- 98 W 45th St
- 102 W 45th St
- 104 W 45th St
- 96 W 45th St
- 96 W 45th St Unit 2
- 101 W 44th St
- 94 W 45th St
- 94 W 45th St Unit 1
- 94 W 45th St Unit 2
- 103 W 44th St
- 99 W 44th St
- 90 W 45th St Unit 92
- 95 W 44th St
- 148 Avenue B
- 150 Avenue B
- 152 Avenue B
- 144 Avenue B Unit 146
- 97 W 44th St