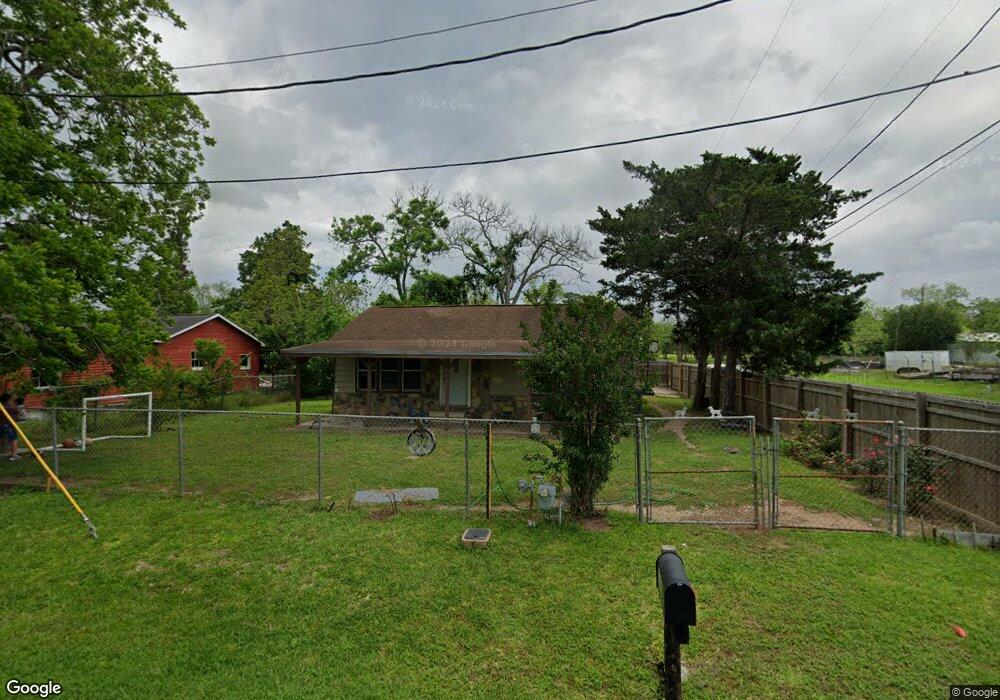
100 W Camp St Brazoria, TX 77422
Estimated Value: $162,142 - $212,000
--
Bed
--
Bath
2,038
Sq Ft
$87/Sq Ft
Est. Value
About This Home
This home is located at 100 W Camp St, Brazoria, TX 77422 and is currently estimated at $177,536, approximately $87 per square foot. 100 W Camp St is a home.
Ownership History
Date
Name
Owned For
Owner Type
Purchase Details
Closed on
Aug 20, 2019
Sold by
Conrad Mary and Robinson Genia
Bought by
Santana Maribel and Santana Juan Jose
Current Estimated Value
Home Financials for this Owner
Home Financials are based on the most recent Mortgage that was taken out on this home.
Original Mortgage
$72,000
Outstanding Balance
$63,059
Interest Rate
3.7%
Mortgage Type
Commercial
Estimated Equity
$114,477
Purchase Details
Closed on
Mar 2, 2018
Sold by
Livanec Eugene Ladd
Bought by
Robinson Genia and Conrad Mary
Create a Home Valuation Report for This Property
The Home Valuation Report is an in-depth analysis detailing your home's value as well as a comparison with similar homes in the area
Home Values in the Area
Average Home Value in this Area
Purchase History
| Date | Buyer | Sale Price | Title Company |
|---|---|---|---|
| Santana Maribel | -- | Alamo Title Company | |
| Robinson Genia | -- | None Available |
Source: Public Records
Mortgage History
| Date | Status | Borrower | Loan Amount |
|---|---|---|---|
| Open | Santana Maribel | $72,000 |
Source: Public Records
Tax History Compared to Growth
Tax History
| Year | Tax Paid | Tax Assessment Tax Assessment Total Assessment is a certain percentage of the fair market value that is determined by local assessors to be the total taxable value of land and additions on the property. | Land | Improvement |
|---|---|---|---|---|
| 2025 | $1,407 | $140,422 | $14,550 | $169,440 |
| 2023 | $1,407 | $116,051 | $13,610 | $179,310 |
| 2022 | $2,383 | $105,501 | $12,010 | $96,620 |
| 2021 | $2,260 | $95,910 | $10,410 | $85,500 |
| 2020 | $2,314 | $93,560 | $9,610 | $83,950 |
| 2019 | $2,210 | $86,590 | $4,310 | $82,280 |
| 2018 | $2,297 | $90,730 | $5,170 | $85,560 |
| 2017 | $2,159 | $90,730 | $5,170 | $85,560 |
| 2016 | $1,963 | $87,910 | $4,310 | $83,600 |
| 2014 | $354 | $62,810 | $4,310 | $58,500 |
Source: Public Records
Map
Nearby Homes