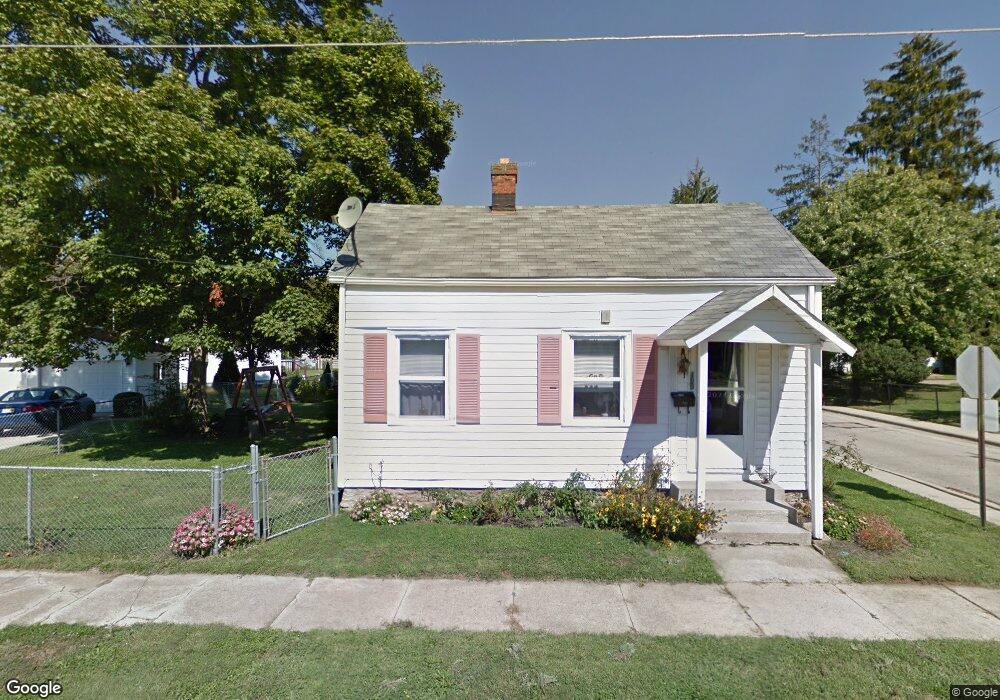
100 W Laird St Cleves, OH 45002
Estimated Value: $105,000 - $143,000
2
Beds
1
Bath
912
Sq Ft
$136/Sq Ft
Est. Value
About This Home
This home is located at 100 W Laird St, Cleves, OH 45002 and is currently estimated at $124,023, approximately $135 per square foot. 100 W Laird St is a home located in Hamilton County with nearby schools including Charles T. Young Elementary School, Taylor Middle School, and Taylor High School.
Ownership History
Date
Name
Owned For
Owner Type
Purchase Details
Closed on
Dec 4, 2019
Sold by
Lane Betty J
Bought by
Doll Christine A
Current Estimated Value
Purchase Details
Closed on
Jun 5, 2013
Sold by
Lane Betty J
Bought by
Lane Betty J and Doll Christine A
Purchase Details
Closed on
Aug 26, 2009
Sold by
Lane Jeff
Bought by
Lane Betty J
Purchase Details
Closed on
Jan 18, 2002
Sold by
Tcif Llc
Bought by
Meansco Investments Llc
Purchase Details
Closed on
Oct 22, 2001
Sold by
Leif Eide and Leif Jane
Bought by
T C I F Llc
Purchase Details
Closed on
Jan 28, 2000
Sold by
Miller Ronald E and Miller Susan J
Bought by
Eide Leif
Home Financials for this Owner
Home Financials are based on the most recent Mortgage that was taken out on this home.
Original Mortgage
$53,100
Interest Rate
8.08%
Purchase Details
Closed on
Jul 30, 1999
Sold by
Gary Rininger
Bought by
Miller Ronald E and Miller Susan J
Create a Home Valuation Report for This Property
The Home Valuation Report is an in-depth analysis detailing your home's value as well as a comparison with similar homes in the area
Home Values in the Area
Average Home Value in this Area
Purchase History
| Date | Buyer | Sale Price | Title Company |
|---|---|---|---|
| Doll Christine A | -- | None Available | |
| Lane Betty J | -- | None Available | |
| Lane Betty J | $20,200 | Attorney | |
| Meansco Investments Llc | $37,000 | Vintage Title Agency Inc | |
| T C I F Llc | $46,000 | Vintage Title Agency Inc | |
| Eide Leif | $55,000 | -- | |
| Miller Ronald E | $27,000 | -- |
Source: Public Records
Mortgage History
| Date | Status | Borrower | Loan Amount |
|---|---|---|---|
| Previous Owner | Eide Leif | $53,100 |
Source: Public Records
Tax History Compared to Growth
Tax History
| Year | Tax Paid | Tax Assessment Tax Assessment Total Assessment is a certain percentage of the fair market value that is determined by local assessors to be the total taxable value of land and additions on the property. | Land | Improvement |
|---|---|---|---|---|
| 2024 | $389 | $18,281 | $3,462 | $14,819 |
| 2023 | $427 | $18,281 | $3,462 | $14,819 |
| 2022 | $213 | $12,394 | $3,269 | $9,125 |
| 2021 | $197 | $12,394 | $3,269 | $9,125 |
| 2020 | $229 | $12,394 | $3,269 | $9,125 |
| 2019 | $212 | $11,918 | $3,143 | $8,775 |
| 2018 | $205 | $11,918 | $3,143 | $8,775 |
| 2017 | $186 | $11,918 | $3,143 | $8,775 |
| 2016 | $6 | $7,070 | $3,143 | $3,927 |
| 2015 | $6 | $7,070 | $3,143 | $3,927 |
| 2014 | $431 | $7,070 | $3,143 | $3,927 |
| 2013 | $10 | $7,070 | $3,143 | $3,927 |
Source: Public Records
Map
Nearby Homes
- 301 N Miami Ave
- 110 Elliott St
- 310 Spring St
- 401 W Porter St
- 116 Scott St
- 101 E State Rd
- 194 E State Rd
- 118 Western Ridge Dr
- 215 Symmes St
- 118 Mount Nebo Rd
- 21 Wamsley Ave
- 143 Mount Nebo Rd
- 23 Ridge Ave
- 3991 E Miami River Rd
- Lot 262 Alexandras Way
- Lot 266 Alexandras Way
- Lot 263 Alexandras Way
- 7284 W Harrison Ave
- 36 Timberline Ct
- 9750 Hooven Ave
- 211 W Porter St
- 200 W Porter St
- 210 W Porter St
- 104 W Laird St
- 125 W Porter St
- 219 W Porter St
- 214 W Porter St
- 122 W Porter St
- 221 W Porter St
- 222 W Porter St
- 203 N Miami Ave
- 207 N Miami Ave
- 118 W Porter St
- 225 W Porter St
- 211 N Miami Ave
- 230 W Porter St
- 112 W Porter St
- 231 W Porter St
- 119 N Miami Ave
- 217 N Miami Ave