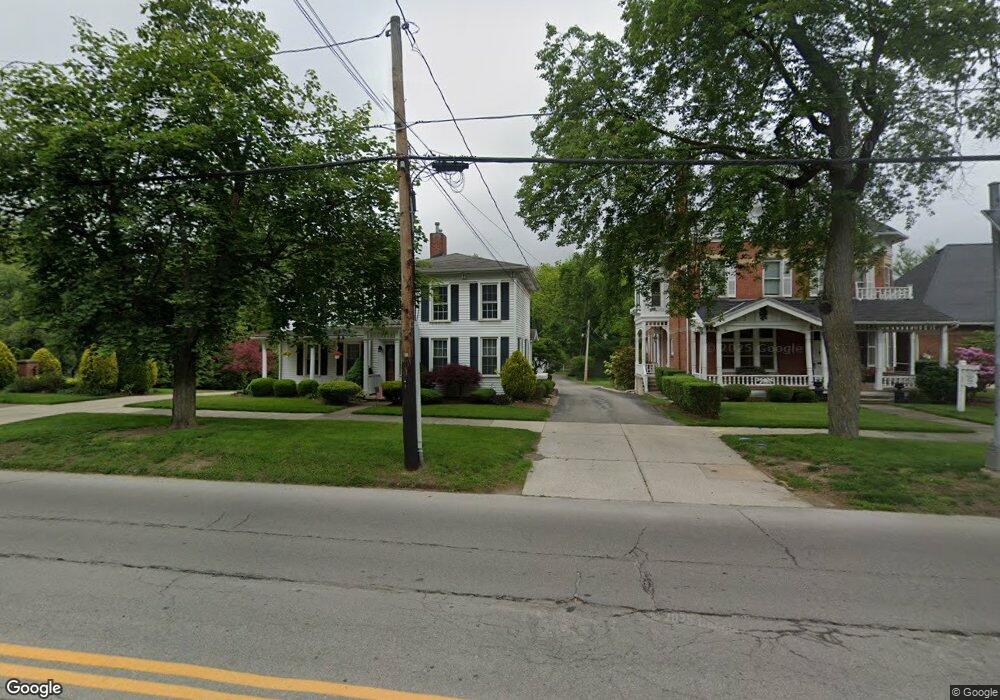
100 W Main St Norwalk, OH 44857
Estimated Value: $150,000 - $209,387
4
Beds
2
Baths
1,954
Sq Ft
$92/Sq Ft
Est. Value
About This Home
This home is located at 100 W Main St, Norwalk, OH 44857 and is currently estimated at $180,097, approximately $92 per square foot. 100 W Main St is a home located in Huron County with nearby schools including Maplehurst Elementary School, Pleasant Elementary School, and League Elementary School.
Ownership History
Date
Name
Owned For
Owner Type
Purchase Details
Closed on
Sep 27, 2018
Sold by
Theta P Investments Llc
Bought by
Eastman Properties Llc
Current Estimated Value
Purchase Details
Closed on
May 18, 2011
Bought by
Thera-P Investments Llc
Purchase Details
Closed on
Sep 20, 2000
Bought by
Walker Edward A and Walker Roxanne S
Purchase Details
Closed on
May 17, 1996
Sold by
H & T Enterprises
Bought by
Walker Robert W and Walker Roxanne
Purchase Details
Closed on
Dec 29, 1986
Bought by
H&T Enterprises
Create a Home Valuation Report for This Property
The Home Valuation Report is an in-depth analysis detailing your home's value as well as a comparison with similar homes in the area
Home Values in the Area
Average Home Value in this Area
Purchase History
| Date | Buyer | Sale Price | Title Company |
|---|---|---|---|
| Eastman Properties Llc | $235,000 | Fidelity National Title | |
| Thera-P Investments Llc | -- | -- | |
| Walker Edward A | $110,000 | -- | |
| Walker Robert W | $110,000 | -- | |
| H&T Enterprises | $86,500 | -- |
Source: Public Records
Mortgage History
| Date | Status | Borrower | Loan Amount |
|---|---|---|---|
| Closed | Walker Robert W | $0 |
Source: Public Records
Tax History Compared to Growth
Tax History
| Year | Tax Paid | Tax Assessment Tax Assessment Total Assessment is a certain percentage of the fair market value that is determined by local assessors to be the total taxable value of land and additions on the property. | Land | Improvement |
|---|---|---|---|---|
| 2024 | $2,297 | $55,260 | $7,570 | $47,690 |
| 2023 | $2,297 | $40,970 | $7,570 | $33,400 |
| 2022 | $1,687 | $40,970 | $7,570 | $33,400 |
| 2021 | $1,688 | $40,970 | $7,570 | $33,400 |
| 2020 | $1,702 | $39,320 | $7,570 | $31,750 |
| 2019 | $1,642 | $38,770 | $7,570 | $31,200 |
| 2018 | $1,614 | $38,770 | $7,570 | $31,200 |
| 2017 | $1,754 | $41,930 | $7,570 | $34,360 |
| 2016 | $1,723 | $41,930 | $7,570 | $34,360 |
| 2015 | $1,722 | $41,930 | $7,570 | $34,360 |
| 2014 | $1,589 | $38,370 | $6,060 | $32,310 |
| 2013 | $1,386 | $38,370 | $6,060 | $32,310 |
Source: Public Records
Map
Nearby Homes