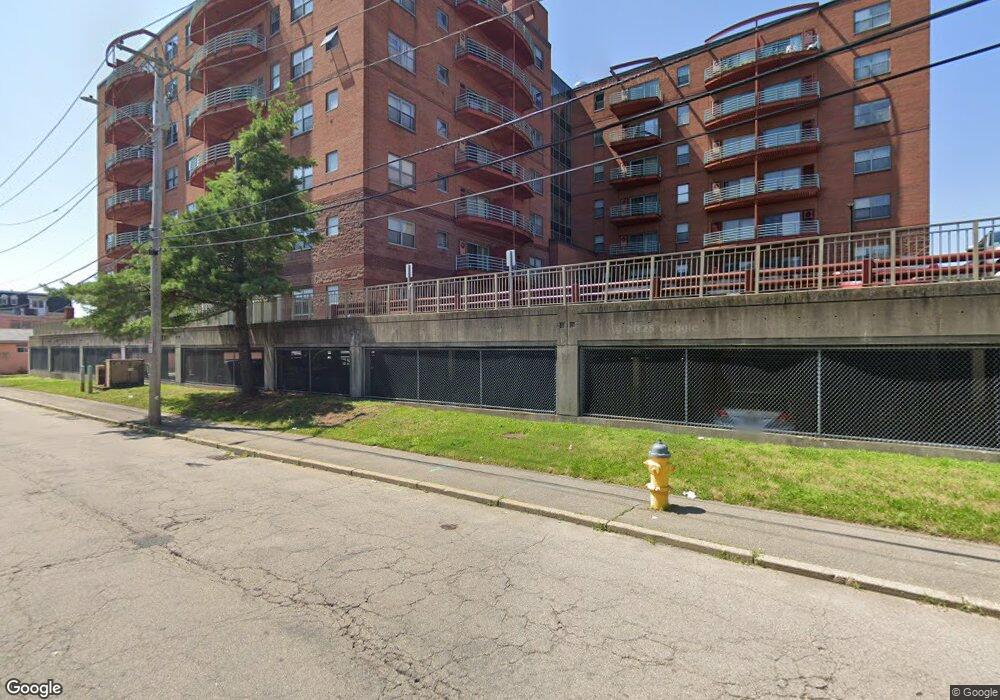
The Montclair Condominiums 100 W Squantum St Unit 715 Quincy, MA 02171
Montclair NeighborhoodEstimated Value: $345,444 - $444,000
1
Bed
1
Bath
645
Sq Ft
$585/Sq Ft
Est. Value
About This Home
This home is located at 100 W Squantum St Unit 715, Quincy, MA 02171 and is currently estimated at $377,361, approximately $585 per square foot. 100 W Squantum St Unit 715 is a home located in Norfolk County with nearby schools including Montclair Elementary School, Atlantic Middle School, and North Quincy High School.
Ownership History
Date
Name
Owned For
Owner Type
Purchase Details
Closed on
Jun 18, 2024
Sold by
Lo Hing K
Bought by
Lo & Poon Irt and Lo
Current Estimated Value
Purchase Details
Closed on
Mar 8, 2007
Sold by
Lo Hing Tung
Bought by
Lo Hing K
Purchase Details
Closed on
Jun 14, 1990
Sold by
Barnside Rlty Corp
Bought by
Lo Hing K
Create a Home Valuation Report for This Property
The Home Valuation Report is an in-depth analysis detailing your home's value as well as a comparison with similar homes in the area
Home Values in the Area
Average Home Value in this Area
Purchase History
| Date | Buyer | Sale Price | Title Company |
|---|---|---|---|
| Lo & Poon Irt | -- | None Available | |
| Lo & Poon Irt | -- | None Available | |
| Lo Hing K | -- | -- | |
| Lo Hing K | -- | -- | |
| Lo Hing K | $74,900 | -- |
Source: Public Records
Tax History Compared to Growth
Tax History
| Year | Tax Paid | Tax Assessment Tax Assessment Total Assessment is a certain percentage of the fair market value that is determined by local assessors to be the total taxable value of land and additions on the property. | Land | Improvement |
|---|---|---|---|---|
| 2025 | $3,715 | $322,200 | $0 | $322,200 |
| 2024 | $3,728 | $330,800 | $0 | $330,800 |
| 2023 | $3,253 | $292,300 | $0 | $292,300 |
| 2022 | $3,372 | $281,500 | $0 | $281,500 |
| 2021 | $3,222 | $265,400 | $0 | $265,400 |
| 2020 | $3,494 | $281,100 | $0 | $281,100 |
| 2019 | $3,730 | $297,200 | $0 | $297,200 |
| 2018 | $3,180 | $238,400 | $0 | $238,400 |
| 2017 | $3,100 | $218,800 | $0 | $218,800 |
| 2016 | $2,947 | $205,200 | $0 | $205,200 |
| 2015 | $2,841 | $194,600 | $0 | $194,600 |
| 2014 | $2,733 | $183,900 | $0 | $183,900 |
Source: Public Records
About The Montclair Condominiums
Map
Nearby Homes
- 115 W Squantum St Unit 907
- 115 W Squantum St Unit 810
- 17 Holmes St Unit 2
- 17 Holmes St Unit 4
- 85 E Squantum St Unit 10
- 143 Arlington St
- 204 Farrington St
- 522 Hancock St
- 250 Fayette St
- 38 Walker St
- 91 Atlantic St
- 68 Atlantic St
- 60 Newbury St Unit 10
- 6 Warwick St
- 133 Commander Shea Blvd Unit 315
- 133 Commander Shea Blvd Unit 609
- 133 Commander Shea Blvd Unit 620
- 133 Commander Shea Blvd Unit 204
- 11 Earle St
- 201 Billings St
- 100 W Squantum St
- 100 W Squantum St Unit 718
- 100 W Squantum St Unit 717
- 100 W Squantum St Unit 716
- 100 W Squantum St Unit 713
- 100 W Squantum St Unit 712
- 100 W Squantum St Unit 711
- 100 W Squantum St Unit 710
- 100 W Squantum St Unit 709
- 100 W Squantum St Unit 708
- 100 W Squantum St Unit 707
- 100 W Squantum St Unit 706
- 100 W Squantum St Unit 705
- 100 W Squantum St Unit 704
- 100 W Squantum St Unit 703
- 100 W Squantum St Unit 702
- 100 W Squantum St Unit 701
- 100 W Squantum St Unit 618
- 100 W Squantum St Unit 617
- 100 W Squantum St Unit 616