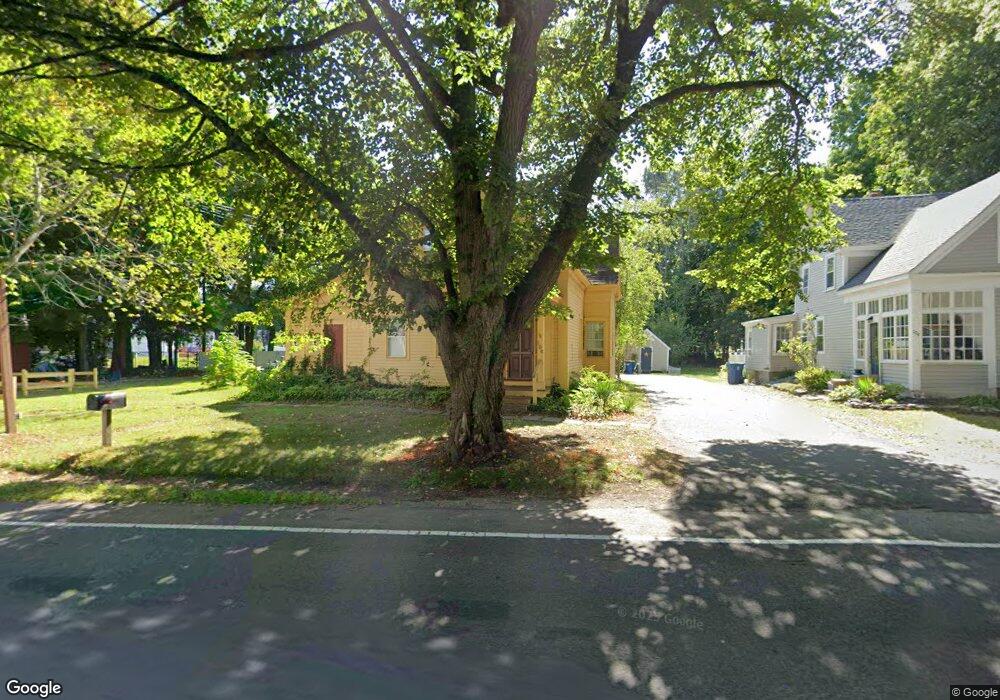
100 West St East Bridgewater, MA 02333
Estimated Value: $583,000 - $790,000
3
Beds
3
Baths
1,419
Sq Ft
$489/Sq Ft
Est. Value
About This Home
This home is located at 100 West St, East Bridgewater, MA 02333 and is currently estimated at $694,233, approximately $489 per square foot. 100 West St is a home located in Plymouth County with nearby schools including Central Elementary School, Gordon W Mitchell Middle School, and East Bridgewater Jr./Sr. High School.
Ownership History
Date
Name
Owned For
Owner Type
Purchase Details
Closed on
Jun 28, 2021
Sold by
Latlippe Vincent K and Latlippe Elena
Bought by
Latlippe Ft and Latlippe
Current Estimated Value
Purchase Details
Closed on
Jan 5, 1973
Bought by
Latlippe Vincent K and Latlippe Elena
Create a Home Valuation Report for This Property
The Home Valuation Report is an in-depth analysis detailing your home's value as well as a comparison with similar homes in the area
Home Values in the Area
Average Home Value in this Area
Purchase History
| Date | Buyer | Sale Price | Title Company |
|---|---|---|---|
| Latlippe Ft | -- | None Available | |
| Latlippe Vincent K | -- | -- |
Source: Public Records
Mortgage History
| Date | Status | Borrower | Loan Amount |
|---|---|---|---|
| Previous Owner | Latlippe Vincent K | $154,600 |
Source: Public Records
Tax History Compared to Growth
Tax History
| Year | Tax Paid | Tax Assessment Tax Assessment Total Assessment is a certain percentage of the fair market value that is determined by local assessors to be the total taxable value of land and additions on the property. | Land | Improvement |
|---|---|---|---|---|
| 2025 | $7,827 | $572,600 | $198,100 | $374,500 |
| 2024 | $7,822 | $565,200 | $190,600 | $374,600 |
| 2023 | $7,747 | $536,100 | $190,600 | $345,500 |
| 2022 | $8,159 | $523,000 | $173,400 | $349,600 |
| 2021 | $7,603 | $445,900 | $158,400 | $287,500 |
| 2020 | $7,525 | $435,200 | $148,200 | $287,000 |
| 2019 | $7,161 | $407,800 | $141,600 | $266,200 |
| 2018 | $6,471 | $360,300 | $134,000 | $226,300 |
| 2017 | $6,345 | $346,700 | $127,800 | $218,900 |
| 2016 | $6,351 | $349,700 | $135,000 | $214,700 |
| 2015 | $6,619 | $372,700 | $155,800 | $216,900 |
| 2014 | $5,755 | $331,300 | $152,600 | $178,700 |
Source: Public Records
Map
Nearby Homes