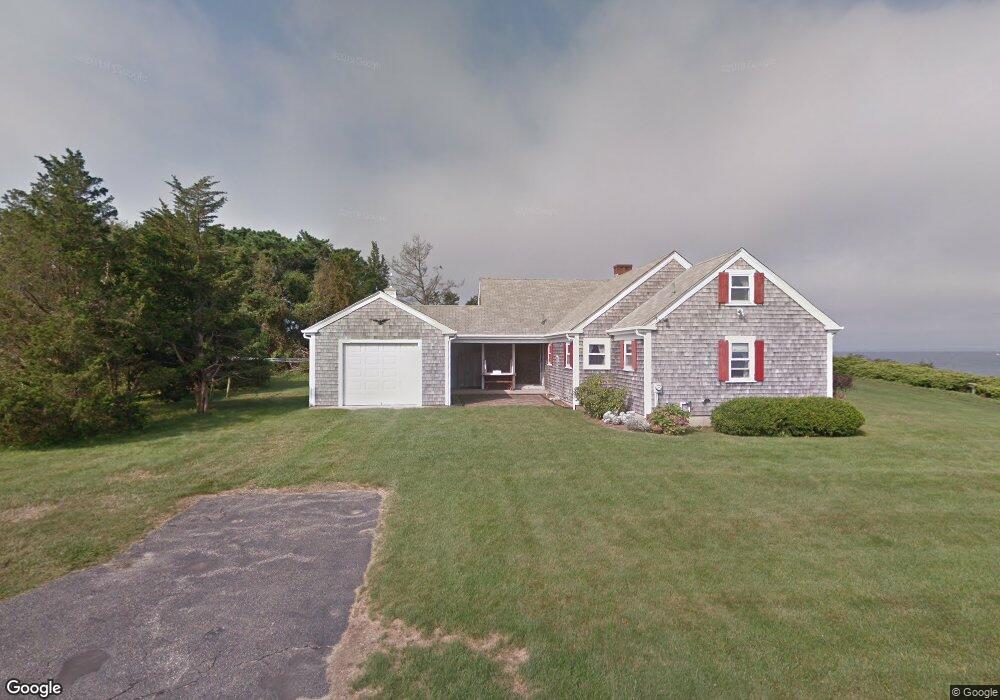
100 Westwood Rd North Falmouth, MA 02556
Estimated Value: $1,409,000 - $2,538,138
4
Beds
2
Baths
1,398
Sq Ft
$1,495/Sq Ft
Est. Value
About This Home
This home is located at 100 Westwood Rd, North Falmouth, MA 02556 and is currently estimated at $2,090,379, approximately $1,495 per square foot. 100 Westwood Rd is a home located in Barnstable County with nearby schools including North Falmouth Elementary School, Morse Pond School, and Lawrence School.
Ownership History
Date
Name
Owned For
Owner Type
Purchase Details
Closed on
Feb 19, 2025
Sold by
Bradford F Hawley T F and Bradford Mitchell
Bought by
Mitchell Pamela K
Current Estimated Value
Purchase Details
Closed on
Jan 16, 2018
Sold by
Hawley Bradford F
Bought by
Bradford F Hawley T F and Bradford Hawley
Purchase Details
Closed on
Jul 1, 1999
Sold by
Nichols Barbara L
Bought by
Hawley Bradford F
Create a Home Valuation Report for This Property
The Home Valuation Report is an in-depth analysis detailing your home's value as well as a comparison with similar homes in the area
Home Values in the Area
Average Home Value in this Area
Purchase History
| Date | Buyer | Sale Price | Title Company |
|---|---|---|---|
| Mitchell Pamela K | -- | None Available | |
| Bradford F Hawley T F | -- | -- | |
| Hawley Bradford F | $392,000 | -- | |
| Hawley Bradford F | $392,000 | -- |
Source: Public Records
Tax History Compared to Growth
Tax History
| Year | Tax Paid | Tax Assessment Tax Assessment Total Assessment is a certain percentage of the fair market value that is determined by local assessors to be the total taxable value of land and additions on the property. | Land | Improvement |
|---|---|---|---|---|
| 2025 | $17,271 | $2,942,300 | $2,535,300 | $407,000 |
| 2024 | $17,472 | $2,782,200 | $2,412,000 | $370,200 |
| 2023 | $18,899 | $2,731,100 | $2,412,000 | $319,100 |
| 2022 | $18,265 | $2,268,900 | $2,011,700 | $257,200 |
| 2021 | $18,295 | $2,152,300 | $1,924,300 | $228,000 |
| 2020 | $16,985 | $1,977,300 | $1,749,300 | $228,000 |
| 2019 | $16,881 | $1,972,100 | $1,749,300 | $222,800 |
| 2018 | $17,102 | $1,958,100 | $1,749,300 | $208,800 |
| 2017 | $16,527 | $1,937,500 | $1,749,300 | $188,200 |
| 2016 | $16,132 | $1,927,300 | $1,749,300 | $178,000 |
| 2015 | $15,785 | $1,927,300 | $1,749,300 | $178,000 |
| 2014 | $15,699 | $1,926,300 | $1,749,300 | $177,000 |
Source: Public Records
Map
Nearby Homes