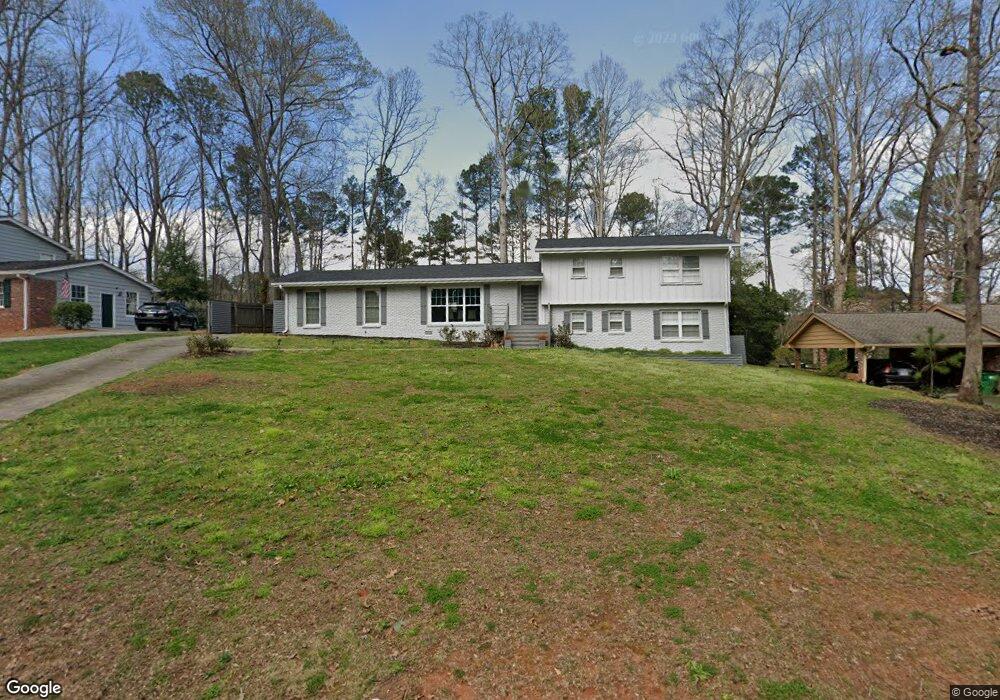
100 Whispering Way NE Unit 6 Atlanta, GA 30328
Estimated Value: $645,000 - $716,000
3
Beds
3
Baths
1,292
Sq Ft
$530/Sq Ft
Est. Value
About This Home
This home is located at 100 Whispering Way NE Unit 6, Atlanta, GA 30328 and is currently estimated at $684,300, approximately $529 per square foot. 100 Whispering Way NE Unit 6 is a home located in Fulton County with nearby schools including Spalding Drive Elementary School, Ridgeview Charter School, and Riverwood International Charter School.
Ownership History
Date
Name
Owned For
Owner Type
Purchase Details
Closed on
Feb 7, 2020
Sold by
Bridges James C
Bought by
Ferrer Oscar and Ferrer Lisbit D Fuenmayor De
Current Estimated Value
Home Financials for this Owner
Home Financials are based on the most recent Mortgage that was taken out on this home.
Original Mortgage
$323,625
Outstanding Balance
$255,267
Interest Rate
3.6%
Mortgage Type
New Conventional
Estimated Equity
$429,033
Purchase Details
Closed on
Jun 9, 2010
Sold by
Amos George E
Bought by
Bridges James C
Home Financials for this Owner
Home Financials are based on the most recent Mortgage that was taken out on this home.
Original Mortgage
$199,200
Interest Rate
3.5%
Mortgage Type
New Conventional
Purchase Details
Closed on
Feb 7, 2002
Sold by
Amos Irma V B
Bought by
Amos Stephen A and Amos George
Purchase Details
Closed on
Dec 16, 1999
Sold by
Amos George E
Bought by
Amos George E and Amos Irma B
Create a Home Valuation Report for This Property
The Home Valuation Report is an in-depth analysis detailing your home's value as well as a comparison with similar homes in the area
Home Values in the Area
Average Home Value in this Area
Purchase History
| Date | Buyer | Sale Price | Title Company |
|---|---|---|---|
| Ferrer Oscar | $431,500 | -- | |
| Bridges James C | $249,000 | -- | |
| Amos Stephen A | -- | -- | |
| Amos George E | -- | -- |
Source: Public Records
Mortgage History
| Date | Status | Borrower | Loan Amount |
|---|---|---|---|
| Open | Ferrer Oscar | $323,625 | |
| Previous Owner | Bridges James C | $199,200 |
Source: Public Records
Tax History Compared to Growth
Tax History
| Year | Tax Paid | Tax Assessment Tax Assessment Total Assessment is a certain percentage of the fair market value that is determined by local assessors to be the total taxable value of land and additions on the property. | Land | Improvement |
|---|---|---|---|---|
| 2025 | $5,370 | $263,320 | $61,880 | $201,440 |
| 2023 | $6,151 | $217,920 | $63,760 | $154,160 |
| 2022 | $5,068 | $183,120 | $63,840 | $119,280 |
| 2021 | $4,834 | $163,840 | $48,360 | $115,480 |
| 2020 | $3,449 | $142,880 | $36,160 | $106,720 |
| 2019 | $3,391 | $140,360 | $35,520 | $104,840 |
| 2018 | $3,756 | $137,080 | $34,680 | $102,400 |
| 2017 | $3,348 | $111,120 | $39,320 | $71,800 |
| 2016 | $3,329 | $111,120 | $39,320 | $71,800 |
| 2015 | $3,338 | $111,120 | $39,320 | $71,800 |
| 2014 | $3,102 | $100,720 | $35,640 | $65,080 |
Source: Public Records
Map
Nearby Homes
- 188 Whispering Pines Blvd
- 6531 Long Acres Dr NW
- 6520 Roswell Rd Unit 68
- 6520 Roswell Rd Unit 47
- 6520 Roswell Rd Unit 3
- 6520 Roswell Rd Unit 59
- 6520 Roswell Rd Unit 59
- 185 Windsor Cove NE
- 6795 Brandon Mill Rd NW Unit 3
- 265 Marchand Ct NW
- 62 High Top Point
- 194 Cromwell Rd NE
- 960 Lost Forest Dr NW
- 75 High Top Ln
- 6771 Sunny Brook Ln NE
- 200 River Valley Ct
- 6595 Beacon Dr
- 16 Bonnie Ln
- 100 Barnard Place NW
- 100 Whispering Way NE
- 110 Whispering Way NE
- 90 Whispering Way NE Unit 6
- 0 Whispering Way NE Unit 8474771
- 0 Whispering Way NE Unit 8048142
- 0 Whispering Way NE Unit 8623053
- 0 Whispering Way NE Unit 9020440
- 0 Whispering Way NE Unit 7290892
- 0 Whispering Way NE
- 136 Whispering Way NE
- 115 Abernathy Rd NW
- 120 Whispering Way NE Unit 6
- 80 Whispering Way NE
- 105 Abernathy Rd NW Unit 2
- 105 Whispering Way NE
- 95 Whispering Way NE
- 131 Abernathy Rd NW
- 6570 Wright Rd NE
- 85 Whispering Way NE
- 6560 Wright Rd NE