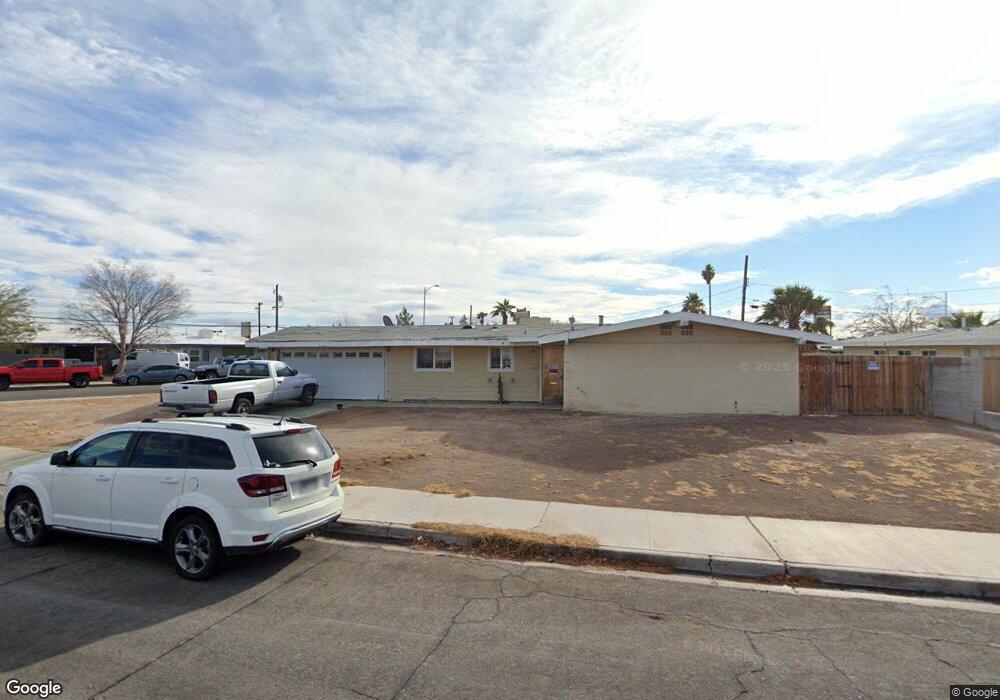
1000 Artesia Way Las Vegas, NV 89108
Twin Lakes NeighborhoodEstimated Value: $271,000 - $331,000
3
Beds
2
Baths
1,227
Sq Ft
$253/Sq Ft
Est. Value
About This Home
This home is located at 1000 Artesia Way, Las Vegas, NV 89108 and is currently estimated at $310,860, approximately $253 per square foot. 1000 Artesia Way is a home located in Clark County with nearby schools including Twin Lakes Elementary School, Robert O Gibson Middle School, and Western High School.
Ownership History
Date
Name
Owned For
Owner Type
Purchase Details
Closed on
Oct 31, 2006
Sold by
Kimble Amy Marie
Bought by
Kimble Richard Mark
Current Estimated Value
Purchase Details
Closed on
Mar 24, 2004
Sold by
Kimble Amy
Bought by
Kimble Richard M
Home Financials for this Owner
Home Financials are based on the most recent Mortgage that was taken out on this home.
Original Mortgage
$108,800
Outstanding Balance
$50,741
Interest Rate
5.64%
Mortgage Type
Unknown
Estimated Equity
$260,119
Purchase Details
Closed on
Mar 22, 2004
Sold by
Rini James Anthony
Bought by
Kimble Richard M
Home Financials for this Owner
Home Financials are based on the most recent Mortgage that was taken out on this home.
Original Mortgage
$108,800
Outstanding Balance
$50,741
Interest Rate
5.64%
Mortgage Type
Unknown
Estimated Equity
$260,119
Purchase Details
Closed on
Dec 14, 1998
Sold by
Rini Maria Christina G
Bought by
Rini James Anthony
Create a Home Valuation Report for This Property
The Home Valuation Report is an in-depth analysis detailing your home's value as well as a comparison with similar homes in the area
Home Values in the Area
Average Home Value in this Area
Purchase History
| Date | Buyer | Sale Price | Title Company |
|---|---|---|---|
| Kimble Richard Mark | $136,000 | None Available | |
| Kimble Richard M | -- | Nevada Title Company | |
| Kimble Richard M | $136,000 | Nevada Title Company | |
| Rini James Anthony | -- | -- |
Source: Public Records
Mortgage History
| Date | Status | Borrower | Loan Amount |
|---|---|---|---|
| Open | Kimble Richard M | $108,800 | |
| Closed | Kimble Richard M | $27,200 |
Source: Public Records
Tax History Compared to Growth
Tax History
| Year | Tax Paid | Tax Assessment Tax Assessment Total Assessment is a certain percentage of the fair market value that is determined by local assessors to be the total taxable value of land and additions on the property. | Land | Improvement |
|---|---|---|---|---|
| 2025 | $781 | $49,708 | $29,925 | $19,783 |
| 2024 | $724 | $49,708 | $29,925 | $19,783 |
| 2023 | $724 | $56,169 | $38,885 | $17,284 |
| 2022 | $671 | $41,773 | $26,180 | $15,593 |
| 2021 | $621 | $37,653 | $23,100 | $14,553 |
| 2020 | $574 | $33,772 | $19,600 | $14,172 |
| 2019 | $538 | $29,128 | $15,400 | $13,728 |
| 2018 | $513 | $30,797 | $17,850 | $12,947 |
| 2017 | $868 | $26,487 | $13,650 | $12,837 |
| 2016 | $482 | $21,196 | $8,750 | $12,446 |
| 2015 | $479 | $17,007 | $4,900 | $12,107 |
| 2014 | $465 | $13,776 | $4,410 | $9,366 |
Source: Public Records
Map
Nearby Homes
- 1103 Arrowhead Ave
- 1106 Arrowhead Ave
- 2632 Chin Cactus Ct
- 913 Jade Plant St
- 1101 Silver Lake Dr
- 2625 Chin Cactus Ct
- 2624 Feather Cactus Ct
- 1204 Arrowhead Ave
- 2521 Rainbow Cactus Ct
- 2520 Bottle Palm Ct
- 1112 Hazard Ave
- 2400 Dutchmans Pipe Ct
- 1225 Arrowhead Ave
- 1313 Purple Sage Ave
- 904 Pyramid Dr
- 812 Pyramid Dr
- 1700 Ferrell St
- 1317 Pyramid Dr
- 111 Narcissus Ln
- 1325 Pyramid Dr
- 916 Artesia Way
- 911 Oasis Cir
- 924 Oasis Ave
- 920 Oasis Ave
- 908 Artesia Way
- 1009 Artesia Way
- 1001 Artesia Way
- 909 Oasis Cir
- 1005 Artesia Way
- 916 Oasis Ave
- 917 Artesia Way
- 1017 Artesia Way
- 913 Artesia Way
- 904 Artesia Way
- 907 Oasis Cir
- 912 Oasis Ave
- 909 Artesia Way
- 2925 Beechwood Place
- 1008 Sahara Way
- 2921 Beechwood Place