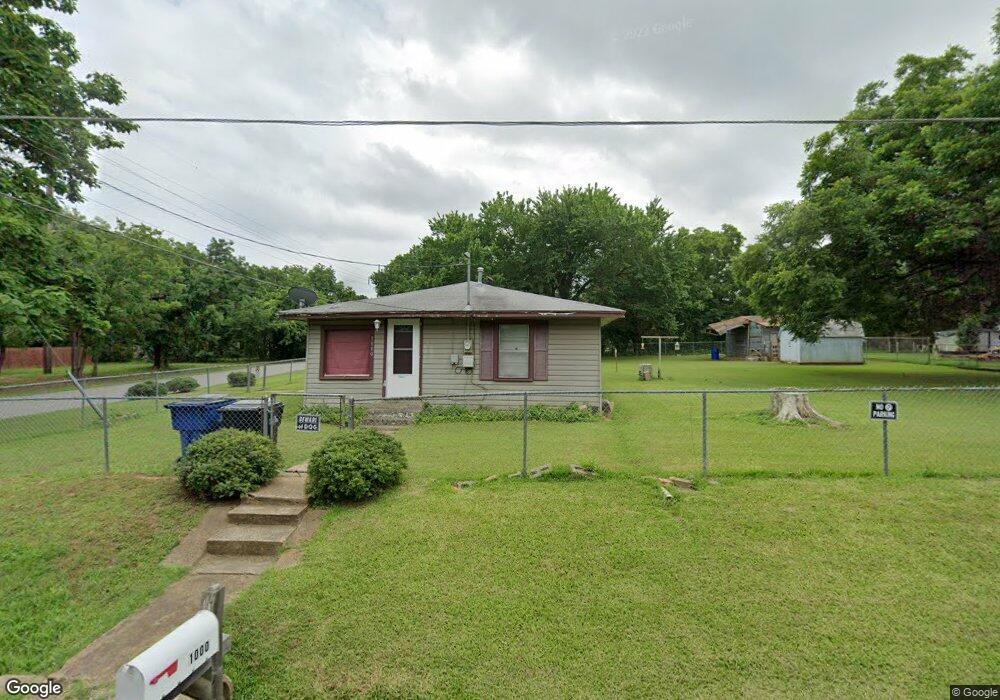
1000 Baker St Denison, TX 75020
Estimated Value: $129,944 - $146,000
Studio
--
Bath
825
Sq Ft
$167/Sq Ft
Est. Value
About This Home
This home is located at 1000 Baker St, Denison, TX 75020 and is currently estimated at $137,972, approximately $167 per square foot. 1000 Baker St is a home located in Grayson County with nearby schools including Scott Middle School, Denison High School, and St. Luke's Parish Day School.
Ownership History
Date
Name
Owned For
Owner Type
Purchase Details
Closed on
Mar 6, 2022
Sold by
James Dunnaway
Bought by
Evolution Realty Llc
Current Estimated Value
Purchase Details
Closed on
Sep 7, 2018
Sold by
Wallis Tara Gayle
Bought by
Edwards Christopher
Purchase Details
Closed on
Dec 1, 2011
Sold by
Clinton R V and Clinton Doris
Bought by
Dunnaway James
Home Financials for this Owner
Home Financials are based on the most recent Mortgage that was taken out on this home.
Original Mortgage
$4,500
Interest Rate
4.13%
Mortgage Type
Seller Take Back
Purchase Details
Closed on
Oct 6, 2009
Sold by
Stinson Wesley
Bought by
Clinton R and Clinton Doris
Purchase Details
Closed on
Jul 24, 2009
Sold by
Stinson Wesley
Bought by
Clinton R and Clinton Doris
Purchase Details
Closed on
Jan 1, 2006
Sold by
Clinton R V and Clinton Doris
Bought by
Stinson Wesley
Home Financials for this Owner
Home Financials are based on the most recent Mortgage that was taken out on this home.
Original Mortgage
$27,262
Interest Rate
6.2%
Mortgage Type
Seller Take Back
Create a Home Valuation Report for This Property
The Home Valuation Report is an in-depth analysis detailing your home's value as well as a comparison with similar homes in the area
Home Values in the Area
Average Home Value in this Area
Purchase History
| Date | Buyer | Sale Price | Title Company |
|---|---|---|---|
| Evolution Realty Llc | -- | New Title Company Name | |
| Edwards Christopher | -- | None Available | |
| Dunnaway James | -- | Sherman Title | |
| Clinton R | $31,000 | Sherman Title | |
| Clinton R | $32,987 | None Available | |
| Stinson Wesley | -- | None Available |
Source: Public Records
Mortgage History
| Date | Status | Borrower | Loan Amount |
|---|---|---|---|
| Previous Owner | Dunnaway James | $4,500 | |
| Previous Owner | Stinson Wesley | $27,262 |
Source: Public Records
Tax History
| Year | Tax Paid | Tax Assessment Tax Assessment Total Assessment is a certain percentage of the fair market value that is determined by local assessors to be the total taxable value of land and additions on the property. | Land | Improvement |
|---|---|---|---|---|
| 2025 | $121 | $76,483 | -- | -- |
| 2024 | $1,615 | $69,530 | $0 | $0 |
| 2023 | $121 | $63,209 | $0 | $0 |
| 2022 | $1,365 | $57,463 | $0 | $0 |
| 2021 | $1,318 | $59,618 | $23,747 | $35,871 |
| 2020 | $1,253 | $56,608 | $19,680 | $36,928 |
| 2019 | $1,188 | $57,264 | $19,680 | $37,584 |
| 2018 | $1,089 | $47,384 | $10,496 | $36,888 |
| 2017 | $998 | $39,697 | $5,773 | $33,924 |
| 2016 | $907 | $35,609 | $5,773 | $29,836 |
Source: Public Records
Map
Nearby Homes
- 901 Dubois St
- 916 W Collins St
- 929 W Collins St
- 603 W Star St
- 1020 Rice St
- 933 Rice St
- 905 Seymore Cir
- 3101 S College Blvd
- 711 Dubois St
- 701 W Star St
- 2931 S Barrett Ave
- 1901 Woodlawn Blvd
- 618 Star St
- 611 W Baker St
- 3312 Vine Ln
- 614 Rice St
- 501 W Collins St
- 528 W Florence St
- 513 W Coffin St
- 509 W Coffin St
Your Personal Tour Guide
Ask me questions while you tour the home.