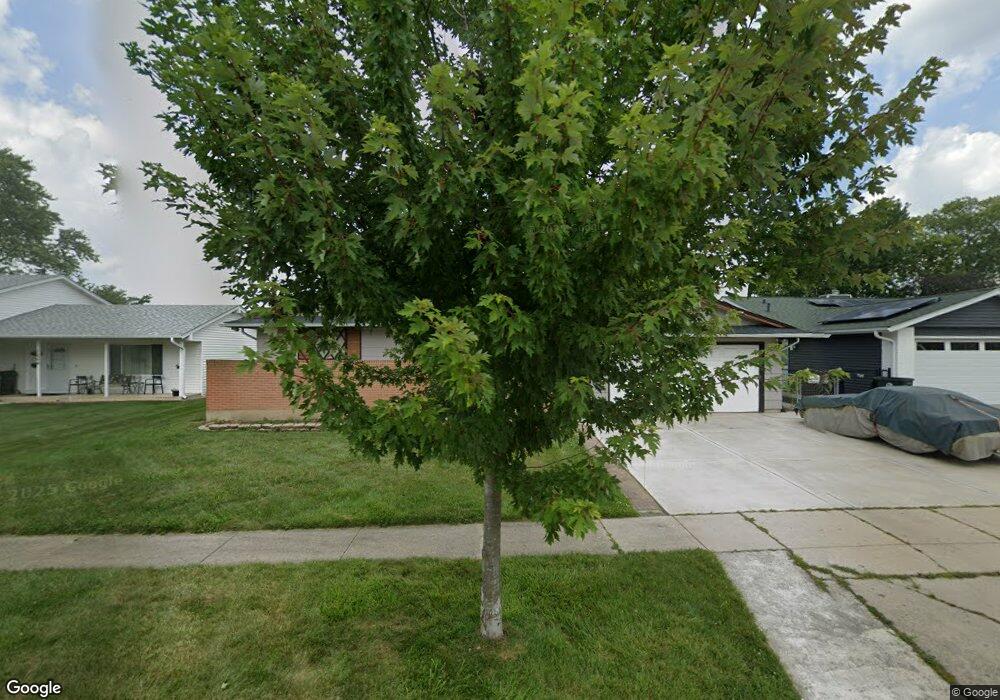
1000 Borman Ct Elk Grove Village, IL 60007
Elk Grove Village West NeighborhoodEstimated Value: $445,000 - $496,000
3
Beds
3
Baths
1,765
Sq Ft
$266/Sq Ft
Est. Value
About This Home
This home is located at 1000 Borman Ct, Elk Grove Village, IL 60007 and is currently estimated at $469,285, approximately $265 per square foot. 1000 Borman Ct is a home located in Cook County with nearby schools including Adolph Link Elementary School, Margaret Mead Junior High School, and J B Conant High School.
Ownership History
Date
Name
Owned For
Owner Type
Purchase Details
Closed on
Aug 16, 2001
Sold by
Delgado Moises M and Delgado Sergio Antonio
Bought by
Delgado Sergio A
Current Estimated Value
Home Financials for this Owner
Home Financials are based on the most recent Mortgage that was taken out on this home.
Original Mortgage
$172,700
Outstanding Balance
$66,588
Interest Rate
6.99%
Mortgage Type
FHA
Estimated Equity
$402,697
Purchase Details
Closed on
Mar 20, 2000
Sold by
Delgado Moises K and Delgado Eva
Bought by
Delgado Moises M and Delgado Sergio Antonio
Home Financials for this Owner
Home Financials are based on the most recent Mortgage that was taken out on this home.
Original Mortgage
$158,400
Interest Rate
8.12%
Purchase Details
Closed on
Aug 27, 1997
Sold by
Ooya Kazunari and Ooya Akane
Bought by
Delgado Moises M and Delgado Eva
Home Financials for this Owner
Home Financials are based on the most recent Mortgage that was taken out on this home.
Original Mortgage
$148,262
Interest Rate
7.57%
Mortgage Type
FHA
Create a Home Valuation Report for This Property
The Home Valuation Report is an in-depth analysis detailing your home's value as well as a comparison with similar homes in the area
Home Values in the Area
Average Home Value in this Area
Purchase History
| Date | Buyer | Sale Price | Title Company |
|---|---|---|---|
| Delgado Sergio A | -- | -- | |
| Delgado Moises M | -- | -- | |
| Delgado Moises M | $106,666 | -- |
Source: Public Records
Mortgage History
| Date | Status | Borrower | Loan Amount |
|---|---|---|---|
| Open | Delgado Sergio A | $172,700 | |
| Closed | Delgado Moises M | $158,400 | |
| Closed | Delgado Moises M | $148,262 |
Source: Public Records
Tax History Compared to Growth
Tax History
| Year | Tax Paid | Tax Assessment Tax Assessment Total Assessment is a certain percentage of the fair market value that is determined by local assessors to be the total taxable value of land and additions on the property. | Land | Improvement |
|---|---|---|---|---|
| 2024 | $10,168 | $35,000 | $7,448 | $27,552 |
| 2023 | $8,919 | $35,000 | $7,448 | $27,552 |
| 2022 | $8,919 | $35,000 | $7,448 | $27,552 |
| 2021 | $6,794 | $24,679 | $6,051 | $18,628 |
| 2020 | $6,691 | $24,679 | $6,051 | $18,628 |
| 2019 | $6,785 | $27,730 | $6,051 | $21,679 |
| 2018 | $6,840 | $25,331 | $5,120 | $20,211 |
| 2017 | $6,784 | $25,331 | $5,120 | $20,211 |
| 2016 | $6,581 | $25,331 | $5,120 | $20,211 |
| 2015 | $5,941 | $21,792 | $4,189 | $17,603 |
| 2014 | $5,879 | $21,792 | $4,189 | $17,603 |
| 2013 | $5,710 | $21,792 | $4,189 | $17,603 |
Source: Public Records
Map
Nearby Homes
- 870 Debra Ln
- 1124 Lovell Ct
- 1189 Grissom Trail
- 1517 White Trail
- 713 Oklahoma Way
- 797 Geneva Cir
- 665 Arizona Pass
- 1093 Gloria Dr
- 1810 Hawk Ln
- 1910 Baltimore Dr
- 833 Thornton Ct Unit 2B
- 826 Thornton Ct Unit 2AL
- 1771 Vermont Dr
- 1022 Tennessee Ln
- 966 Cumberland Ct Unit B2
- 1057 Talbots Ln Unit A
- 1057 Savoy Ct Unit 221713
- 263 Doral Ct Unit 1
- 307 University Ln Unit A
- 630 Cross Creek Dr W Unit BB2
- 994 Borman Ct
- 1004 Borman Ct
- 983 W Glenn Trail
- 975 W Glenn Trail
- 995 W Glenn Trail
- 970 Borman Ct
- 978 Borman Ct
- 967 W Glenn Trail
- 1007 Borman Ct
- 1013 Borman Ct
- 999 Borman Ct
- 966 Borman Ct
- 995 Borman Ct
- 1017 Borman Ct
- 959 W Glenn Trail
- 958 Borman Ct
- 1033 Conrad Ct
- 991 Borman Ct
- 1031 Conrad Ct
- 1035 Conrad Ct