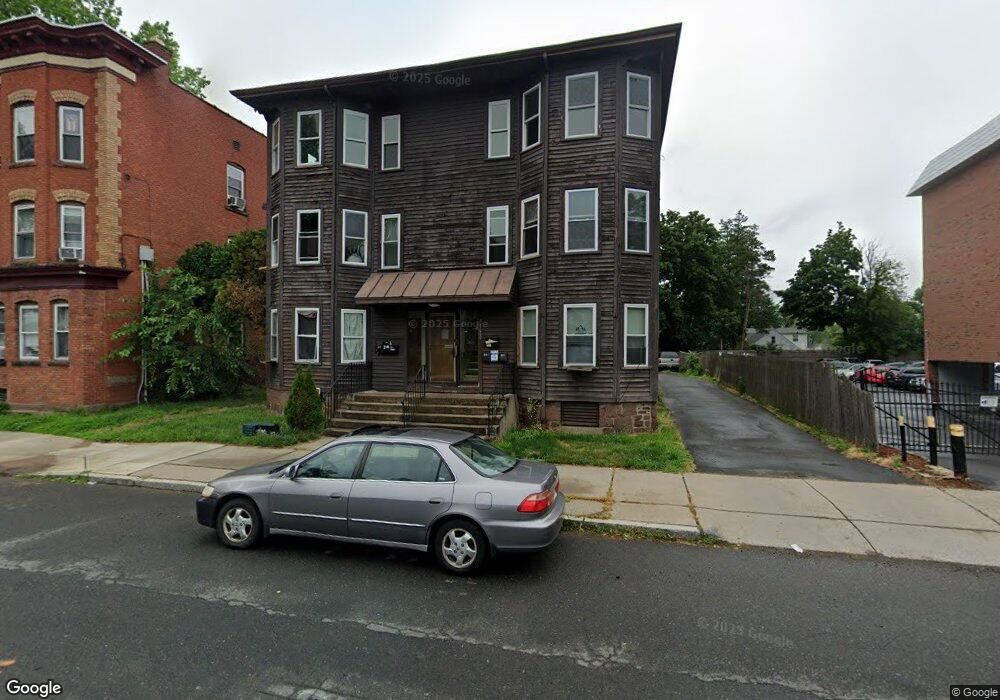
1000 Capitol Ave Unit 5B Hartford, CT 06106
West End NeighborhoodEstimated Value: $115,000 - $180,000
2
Beds
1
Bath
1,010
Sq Ft
$141/Sq Ft
Est. Value
About This Home
This home is located at 1000 Capitol Ave Unit 5B, Hartford, CT 06106 and is currently estimated at $142,772, approximately $141 per square foot. 1000 Capitol Ave Unit 5B is a home located in Hartford County with nearby schools including Burns Latino Studies Academy, Sanchez School, and Environmental Sciences Magnet School at Mary Hooker.
Ownership History
Date
Name
Owned For
Owner Type
Purchase Details
Closed on
Apr 6, 2021
Sold by
Hrh 1040 Llc
Bought by
1000 Capitol Llc
Current Estimated Value
Purchase Details
Closed on
Jul 18, 2018
Sold by
Newbrit Capital Ave Ll
Bought by
Hrh 1040 Llc
Home Financials for this Owner
Home Financials are based on the most recent Mortgage that was taken out on this home.
Original Mortgage
$600,000
Interest Rate
4.5%
Mortgage Type
Purchase Money Mortgage
Purchase Details
Closed on
Dec 31, 2015
Sold by
Lucrum Realty Llc
Bought by
Newbrit Capital Ave Llc
Purchase Details
Closed on
Jun 11, 2015
Sold by
Pbe Companies Llc
Bought by
Lucrum Realty Llc
Purchase Details
Closed on
Mar 24, 2015
Sold by
Miale Frank
Bought by
Pbe Companies Llc
Purchase Details
Closed on
Nov 20, 2014
Sold by
Fam Realty
Bought by
Pbe Companies Llc
Create a Home Valuation Report for This Property
The Home Valuation Report is an in-depth analysis detailing your home's value as well as a comparison with similar homes in the area
Home Values in the Area
Average Home Value in this Area
Purchase History
| Date | Buyer | Sale Price | Title Company |
|---|---|---|---|
| 1000 Capitol Llc | $999,000 | None Available | |
| Hrh 1040 Llc | $800,000 | -- | |
| Newbrit Capital Ave Llc | -- | -- | |
| Lucrum Realty Llc | $210,000 | -- | |
| Pbe Companies Llc | $204,000 | -- | |
| Pbe Companies Llc | $204,000 | -- |
Source: Public Records
Mortgage History
| Date | Status | Borrower | Loan Amount |
|---|---|---|---|
| Previous Owner | Pbe Companies Llc | $600,000 |
Source: Public Records
Tax History Compared to Growth
Tax History
| Year | Tax Paid | Tax Assessment Tax Assessment Total Assessment is a certain percentage of the fair market value that is determined by local assessors to be the total taxable value of land and additions on the property. | Land | Improvement |
|---|---|---|---|---|
| 2025 | $1,923 | $27,893 | $0 | $27,893 |
| 2024 | $1,923 | $27,893 | $0 | $27,893 |
| 2023 | $1,923 | $27,893 | $0 | $27,893 |
| 2022 | $1,923 | $27,893 | $0 | $27,893 |
| 2021 | $952 | $12,810 | $0 | $12,810 |
| 2020 | $952 | $12,810 | $0 | $12,810 |
| 2019 | $952 | $12,810 | $0 | $12,810 |
| 2018 | $920 | $12,378 | $0 | $12,378 |
| 2016 | $876 | $11,789 | $0 | $11,789 |
| 2015 | $834 | $11,229 | $0 | $11,229 |
| 2014 | $814 | $10,954 | $0 | $10,954 |
Source: Public Records
Map
Nearby Homes
- 126 Heath St
- 2 Rodney St
- 82 S Whitney St
- 45 Warrenton Ave Unit 47
- 54 James St Unit 56
- 90-92 Rowe Ave
- 39 S Whitney St
- 14 Gray St Unit 16
- 478 Prospect Ave
- 18 S Whitney St
- 27 Sisson Ave Unit 29
- 518 Prospect Ave
- 34 Sisson Ave
- 838 Capitol Ave Unit 840
- 16 Lockwood Terrace
- 21 Warren Terrace
- 46 New Park Ave
- 28 Whitney St
- 40 Owen St Unit B5
- 40 Owen St Unit A3
- 1000 Capitol Ave Unit 2A
- 1000 Capitol Ave Unit 6B1008
- 1000 Capitol Ave Unit 5B1008
- 1000 Capitol Ave Unit 4B1008
- 1000 Capitol Ave Unit 3B1008
- 1000 Capitol Ave Unit 1B1008
- 1000 Capitol Ave Unit 1A
- 1000 Capitol Ave Unit 2A
- 1000 Capitol Ave
- 1008 Capitol Ave Unit 1-A
- 1008 Capitol Ave Unit 6A
- 1008 Capitol Ave
- 1012 Capitol Ave
- 1016 Capitol Ave
- 989 Capitol Ave
- 989 Capitol Ave
- 989 Capitol Ave Unit 2
- 100 Amity St Unit 2
- 100 Amity St Unit 2nd Floor
- 99 Amity St Unit 101