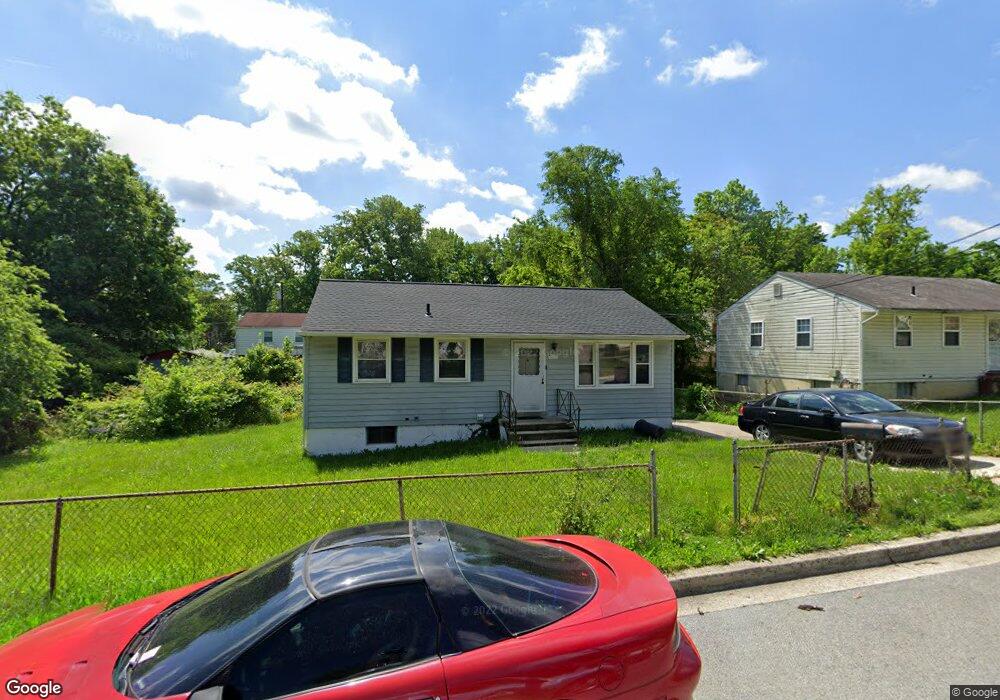
1000 Drum Ave Capitol Heights, MD 20743
Estimated Value: $258,000 - $348,000
4
Beds
2
Baths
900
Sq Ft
$357/Sq Ft
Est. Value
About This Home
This home is located at 1000 Drum Ave, Capitol Heights, MD 20743 and is currently estimated at $321,010, approximately $356 per square foot. 1000 Drum Ave is a home located in Prince George's County with nearby schools including William W. Hall Academy, Suitland High School, and Rocketship Dc Public Charter School - Legacy Prep.
Ownership History
Date
Name
Owned For
Owner Type
Purchase Details
Closed on
Sep 22, 2008
Sold by
Snowden Alonzo
Bought by
Bynum Yvonne
Current Estimated Value
Home Financials for this Owner
Home Financials are based on the most recent Mortgage that was taken out on this home.
Original Mortgage
$168,500
Outstanding Balance
$112,183
Interest Rate
6.54%
Mortgage Type
VA
Estimated Equity
$208,827
Purchase Details
Closed on
Sep 8, 2008
Sold by
Snowden Alonzo
Bought by
Bynum Yvonne
Home Financials for this Owner
Home Financials are based on the most recent Mortgage that was taken out on this home.
Original Mortgage
$168,500
Outstanding Balance
$112,183
Interest Rate
6.54%
Mortgage Type
VA
Estimated Equity
$208,827
Purchase Details
Closed on
Sep 14, 2004
Sold by
Blair George R
Bought by
Snowden Alonzo
Purchase Details
Closed on
Jun 30, 1975
Sold by
Kenrock Builders
Bought by
Blair George R and Blair Marian E
Create a Home Valuation Report for This Property
The Home Valuation Report is an in-depth analysis detailing your home's value as well as a comparison with similar homes in the area
Home Values in the Area
Average Home Value in this Area
Purchase History
| Date | Buyer | Sale Price | Title Company |
|---|---|---|---|
| Bynum Yvonne | $165,000 | -- | |
| Bynum Yvonne | $165,000 | -- | |
| Snowden Alonzo | $145,000 | -- | |
| Blair George R | $35,300 | -- |
Source: Public Records
Mortgage History
| Date | Status | Borrower | Loan Amount |
|---|---|---|---|
| Open | Bynum Yvonne | $168,500 | |
| Closed | Bynum Yvonne | $168,500 |
Source: Public Records
Tax History Compared to Growth
Tax History
| Year | Tax Paid | Tax Assessment Tax Assessment Total Assessment is a certain percentage of the fair market value that is determined by local assessors to be the total taxable value of land and additions on the property. | Land | Improvement |
|---|---|---|---|---|
| 2025 | $3,230 | $269,867 | -- | -- |
| 2024 | $3,230 | $249,233 | $0 | $0 |
| 2023 | $3,081 | $228,600 | $60,800 | $167,800 |
| 2022 | $2,358 | $212,067 | $0 | $0 |
| 2021 | $5,700 | $195,533 | $0 | $0 |
| 2020 | $3,804 | $179,000 | $45,400 | $133,600 |
| 2019 | $2,434 | $169,967 | $0 | $0 |
| 2018 | $2,489 | $160,933 | $0 | $0 |
| 2017 | $2,402 | $151,900 | $0 | $0 |
| 2016 | -- | $143,900 | $0 | $0 |
| 2015 | $2,879 | $135,900 | $0 | $0 |
| 2014 | $2,879 | $127,900 | $0 | $0 |
Source: Public Records
Map
Nearby Homes