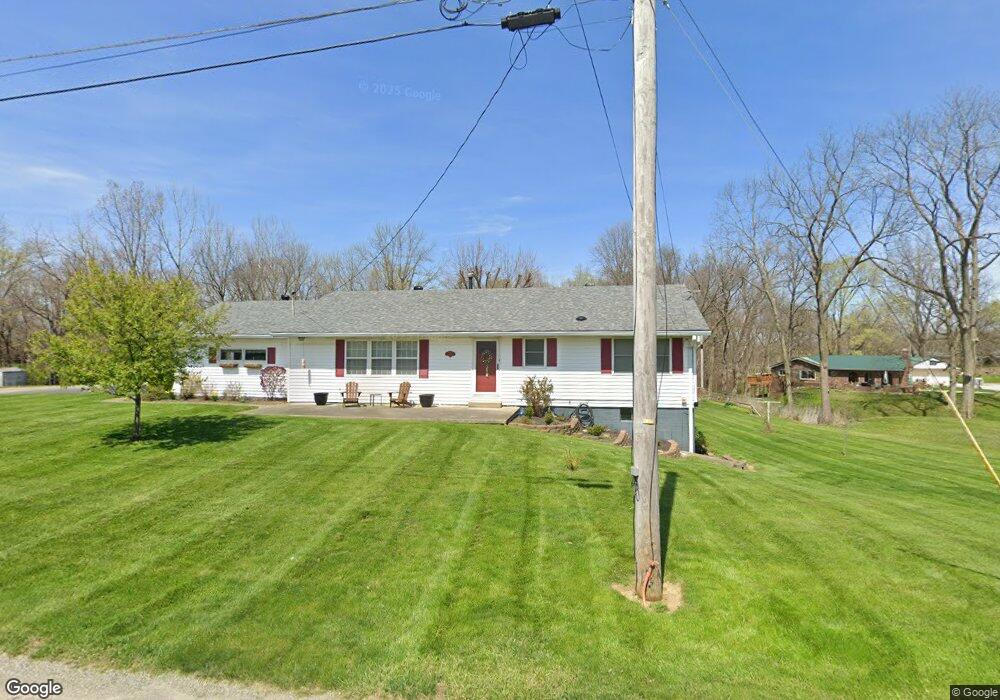
1000 E Maple St Frankton, IN 46044
Estimated Value: $176,000 - $286,000
About This Home
This home is located at 1000 E Maple St, Frankton, IN 46044 and is currently estimated at $217,274, approximately $132 per square foot. 1000 E Maple St is a home with nearby schools including Frankton Elementary School and Frankton Junior/Senior High School.
Ownership History
We collect this data history from publicly available records. To have your information removed, we recommend requesting removal directly through your county’s website.
Purchase Details
Home Financials for this Owner
Home Financials are based on the most recent Mortgage that was taken out on this home.Home Values in the Area
Average Home Value in this Area
Purchase History
We collect this data history from publicly available records. To have your information removed, we recommend requesting removal directly through your county’s website.
| Date | Buyer | Sale Price | Title Company |
|---|---|---|---|
| -- | -- |
Mortgage History
We collect this data history from publicly available records. To have your information removed, we recommend requesting removal directly through your county’s website.
| Date | Status | Borrower | Loan Amount |
|---|---|---|---|
| Closed | $35,060 |
Tax History
We collect this data history from publicly available records. To have your information removed, we recommend requesting removal directly through your county’s website.
| Year | Tax Paid | Tax Assessment Tax Assessment Total Assessment is a certain percentage of the fair market value that is determined by local assessors to be the total taxable value of land and additions on the property. | Land | Improvement |
|---|---|---|---|---|
| 2025 | $1,301 | $144,500 | $8,900 | $135,600 |
| 2024 | $1,278 | $127,800 | $8,900 | $118,900 |
| 2023 | $1,162 | $127,300 | $8,500 | $118,800 |
| 2022 | $1,267 | $126,700 | $7,900 | $118,800 |
| 2021 | $1,162 | $116,200 | $7,900 | $108,300 |
| 2020 | $1,065 | $106,500 | $7,000 | $99,500 |
| 2019 | $1,036 | $103,600 | $7,000 | $96,600 |
| 2018 | $974 | $97,400 | $7,000 | $90,400 |
| 2017 | $961 | $96,100 | $7,000 | $89,100 |
| 2016 | $1,033 | $103,300 | $7,000 | $96,300 |
| 2014 | $1,016 | $101,600 | $7,000 | $94,600 |
| 2013 | $1,016 | $101,600 | $7,000 | $94,600 |
Map
- 1006 E Walnut St
- 208 Woodworth St
- 601 E Clyde St
- 503 E Sigler St
- 601 Harrison St
- 603 Harrison St
- 911 Harrison St
- 603 E Clyde St
- 4524 W 850 N
- 207 Jackson St
- TBD W 700 N
- 0 N 400 W Unit MBR22101670
- 42 N Leota St
- 909 Independence Dr E
- 0 900 W
- 10261 N State Road 37
- 7010 Indiana 28
- 2800 S K St
- 1225 S 25th St
- 11940 N 750 W
Ask me questions while you tour the home.