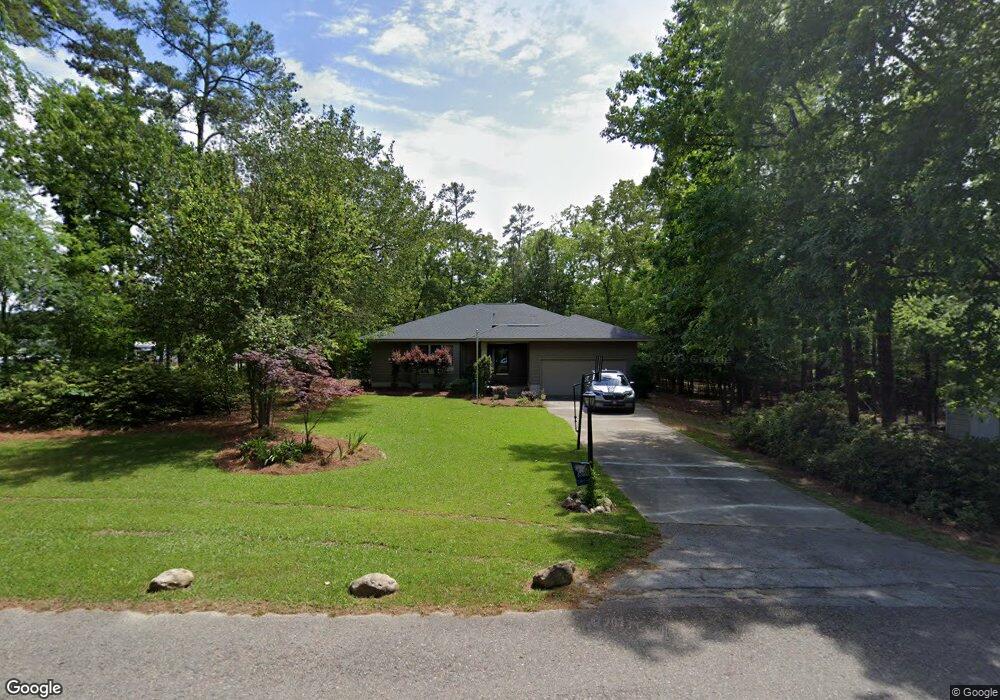
1000 Ellett Rd Chapin, SC 29036
Estimated Value: $396,000 - $547,636
3
Beds
2
Baths
2,045
Sq Ft
$232/Sq Ft
Est. Value
About This Home
This home is located at 1000 Ellett Rd, Chapin, SC 29036 and is currently estimated at $475,159, approximately $232 per square foot. 1000 Ellett Rd is a home located in Richland County with nearby schools including Lake Murray Elementary School, Chapin Intermediate, and Chapin High School.
Ownership History
Date
Name
Owned For
Owner Type
Purchase Details
Closed on
Jan 31, 2019
Sold by
Rainy Steve
Bought by
Greene Bon Michael and Greene Margaret A
Current Estimated Value
Home Financials for this Owner
Home Financials are based on the most recent Mortgage that was taken out on this home.
Original Mortgage
$251,750
Outstanding Balance
$220,897
Interest Rate
4.6%
Mortgage Type
New Conventional
Estimated Equity
$254,262
Purchase Details
Closed on
Jul 29, 2013
Sold by
Hunsaker Debra
Bought by
Rainy Steve
Purchase Details
Closed on
Jun 23, 2008
Sold by
Hunsaker Kevin
Bought by
Hunsaker Debra
Home Financials for this Owner
Home Financials are based on the most recent Mortgage that was taken out on this home.
Original Mortgage
$152,500
Interest Rate
6.37%
Mortgage Type
Purchase Money Mortgage
Purchase Details
Closed on
Jul 19, 2005
Sold by
Lavisky Sheri E
Bought by
Hunsaker Kevin and Hunsaker Debra
Home Financials for this Owner
Home Financials are based on the most recent Mortgage that was taken out on this home.
Original Mortgage
$169,575
Interest Rate
5.46%
Mortgage Type
Fannie Mae Freddie Mac
Create a Home Valuation Report for This Property
The Home Valuation Report is an in-depth analysis detailing your home's value as well as a comparison with similar homes in the area
Home Values in the Area
Average Home Value in this Area
Purchase History
| Date | Buyer | Sale Price | Title Company |
|---|---|---|---|
| Greene Bon Michael | $265,000 | None Available | |
| Rainy Steve | $195,000 | None Available | |
| Hunsaker Debra | -- | -- | |
| Hunsaker Kevin | $178,500 | -- |
Source: Public Records
Mortgage History
| Date | Status | Borrower | Loan Amount |
|---|---|---|---|
| Open | Greene Bon Michael | $251,750 | |
| Previous Owner | Hunsaker Debra | $152,500 | |
| Previous Owner | Hunsaker Kevin | $169,575 |
Source: Public Records
Tax History Compared to Growth
Tax History
| Year | Tax Paid | Tax Assessment Tax Assessment Total Assessment is a certain percentage of the fair market value that is determined by local assessors to be the total taxable value of land and additions on the property. | Land | Improvement |
|---|---|---|---|---|
| 2024 | $8,695 | $304,800 | $0 | $0 |
| 2023 | $2,139 | $10,600 | $0 | $0 |
| 2022 | $1,812 | $265,000 | $43,200 | $221,800 |
| 2021 | $1,827 | $10,600 | $0 | $0 |
| 2020 | $1,910 | $10,600 | $0 | $0 |
| 2019 | $1,830 | $8,260 | $0 | $0 |
| 2018 | $1,546 | $7,800 | $0 | $0 |
| 2017 | $1,507 | $7,800 | $0 | $0 |
| 2016 | $1,500 | $7,800 | $0 | $0 |
| 2015 | $1,507 | $7,800 | $0 | $0 |
| 2014 | $5,021 | $195,000 | $0 | $0 |
| 2013 | -- | $7,800 | $0 | $0 |
Source: Public Records
Map
Nearby Homes
- 123 Jasmine Bay Ln
- 0 Johnson Marina Rd Unit 539063
- 1304 Silver Point Rd
- 177 Lakeport Dr
- 312 Lanyard Ln
- 149 Lakeport Dr
- 608 Calypso Ct
- 613 Calypso Ct
- 304 Racket Rd
- 756 Helmsman Ln
- 739 Helmsman Ln
- 313 Explorer Dr
- 180 Wahoo Cir
- 297 Wahoo Cir
- 740 Ruskin Dr
- 550 Malachite Ln
- 515 Malachite Ln
- 509 Malachite Ln
- 13 Botticelli Ct
- 175 Almofini Ln
- 1822 Johnson Marina Rd
- 1002 Lighthouse Rd
- 4 Elm Spring Ct
- 100 Jasmine Bay
- 1820 Johnson Marina Rd
- 6 Elm Spring Ct
- 101 Jasmine Bay
- 1818 Johnson Marina Rd
- 1017 Ellett Rd
- 1924 Johnson Marina Rd
- 7 Elm Spring Ct
- 103 Jasmine Bay
- 106 Jasmine Bay
- 1810 Johnson Marina Rd
- 115 Robauld Ave
- 105 Jasmine Bay Ln
- 1025 Ellett Rd
- 1008 Lighthouse Rd
- 1928 Johnson Marina Rd
- 108 Jasmine Bay Ln