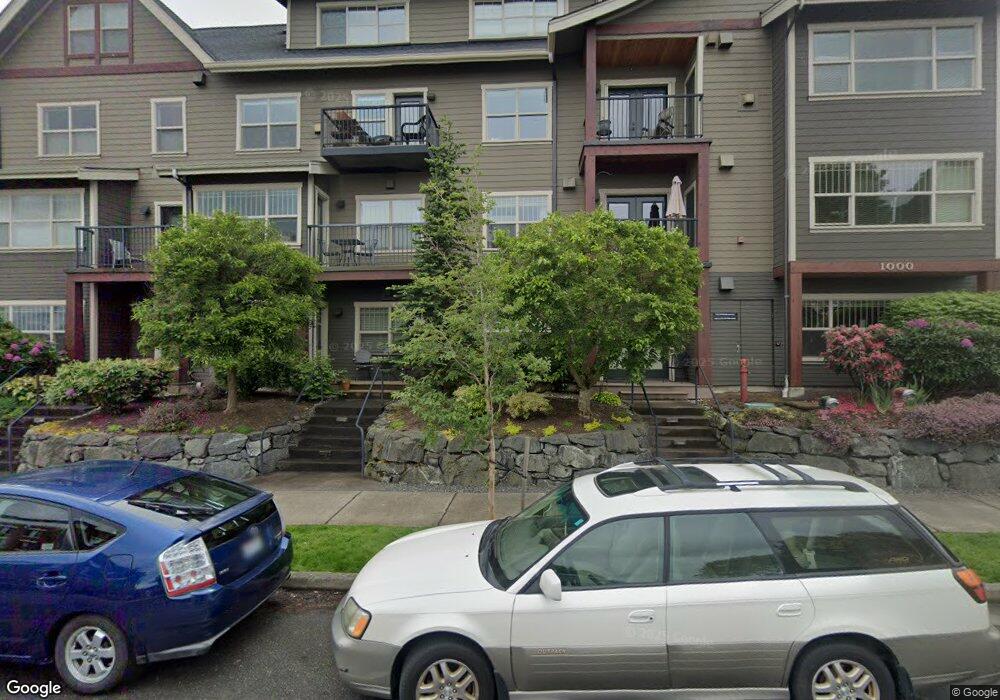
1000 High St Unit 204 Bellingham, WA 98225
Sehome NeighborhoodEstimated Value: $461,000 - $559,000
2
Beds
2
Baths
936
Sq Ft
$560/Sq Ft
Est. Value
About This Home
This home is located at 1000 High St Unit 204, Bellingham, WA 98225 and is currently estimated at $524,154, approximately $559 per square foot. 1000 High St Unit 204 is a home located in Whatcom County with nearby schools including Lowell Elementary School, Fairhaven Middle School, and Sehome High School.
Ownership History
Date
Name
Owned For
Owner Type
Purchase Details
Closed on
Oct 5, 2023
Sold by
Dorn Rena T
Bought by
Dorn Thomas M
Current Estimated Value
Purchase Details
Closed on
Apr 28, 2021
Sold by
Gonzalez Katherine Rhoades and Gonzalez Nasser Andres
Bought by
Dorn Thomas M and Dorn Rena T
Home Financials for this Owner
Home Financials are based on the most recent Mortgage that was taken out on this home.
Original Mortgage
$275,000
Interest Rate
3%
Mortgage Type
New Conventional
Purchase Details
Closed on
Aug 22, 2015
Sold by
Volkmann Roger J and Volkmann Susan R
Bought by
Rhoades Katherine
Home Financials for this Owner
Home Financials are based on the most recent Mortgage that was taken out on this home.
Original Mortgage
$289,750
Interest Rate
3.12%
Mortgage Type
Adjustable Rate Mortgage/ARM
Purchase Details
Closed on
Dec 20, 2007
Sold by
High Street Llc
Bought by
Volkmann Roger J and Volkmann Susan R
Home Financials for this Owner
Home Financials are based on the most recent Mortgage that was taken out on this home.
Interest Rate
6.14%
Create a Home Valuation Report for This Property
The Home Valuation Report is an in-depth analysis detailing your home's value as well as a comparison with similar homes in the area
Home Values in the Area
Average Home Value in this Area
Purchase History
| Date | Buyer | Sale Price | Title Company |
|---|---|---|---|
| Dorn Thomas M | $313 | None Listed On Document | |
| Dorn Thomas M | $425,000 | Whatcom Land Title | |
| Rhoades Katherine | $305,000 | Chicago Title Insurance | |
| Volkmann Roger J | $609,260 | -- |
Source: Public Records
Mortgage History
| Date | Status | Borrower | Loan Amount |
|---|---|---|---|
| Previous Owner | Dorn Thomas M | $275,000 | |
| Previous Owner | Rhoades Katherine | $289,750 | |
| Previous Owner | Volkmann Roger J | -- |
Source: Public Records
Tax History Compared to Growth
Tax History
| Year | Tax Paid | Tax Assessment Tax Assessment Total Assessment is a certain percentage of the fair market value that is determined by local assessors to be the total taxable value of land and additions on the property. | Land | Improvement |
|---|---|---|---|---|
| 2024 | $4,264 | $547,757 | $90,240 | $457,517 |
| 2023 | $4,264 | $547,757 | $90,240 | $457,517 |
| 2022 | $3,721 | $452,701 | $74,580 | $378,121 |
| 2021 | $3,584 | $400,620 | $66,000 | $334,620 |
| 2020 | $3,619 | $364,200 | $60,000 | $304,200 |
| 2019 | $2,985 | $355,450 | $77,216 | $278,234 |
| 2018 | $3,307 | $293,884 | $63,841 | $230,043 |
| 2017 | $2,738 | $278,397 | $60,458 | $217,939 |
| 2016 | $2,460 | $240,951 | $52,324 | $188,627 |
| 2015 | $2,485 | $225,360 | $48,974 | $176,386 |
| 2014 | -- | $220,270 | $47,850 | $172,420 |
| 2013 | -- | $220,270 | $47,850 | $172,420 |
Source: Public Records
Map
Nearby Homes
- 615 E Myrtle St
- 616 E Myrtle St
- 1126 N Forest St
- 901 N Forest St Unit 107
- 901 N Forest St Unit 125
- 901 N Forest St Unit 109
- 1001 N State St Unit 403
- 1031 N State St Unit 107
- 1031 N State St Unit 209
- 310 E Ivy St
- 1015 Railroad Ave Unit 418
- 1309 Billy Frank Jr St
- 1205 E Maple St
- 1342 Franklin St
- 1234 Grant St
- 1125 Otis St
- 1335 Humboldt St
- 5 XX Gladstone St
- 0 Pine St Unit NWM2445229
- 500 Gladstone St
- 1000 High St
- 1000 High St Unit 305
- 1000 High St Unit 304
- 1000 High St Unit 303
- 1000 High St Unit 301
- 1000 High St Unit 206
- 1000 High St Unit 205
- 1000 High St Unit 203
- 1000 High St Unit 202
- 1000 High St Unit 201
- 1000 High St Unit 106
- 1000 High St Unit 105
- 1000 High St Unit 104
- 1000 High St Unit 103
- 1000 High St Unit 204
- 1000 High St Unit 401
- 1010 High St Unit B101
- 1004 High St