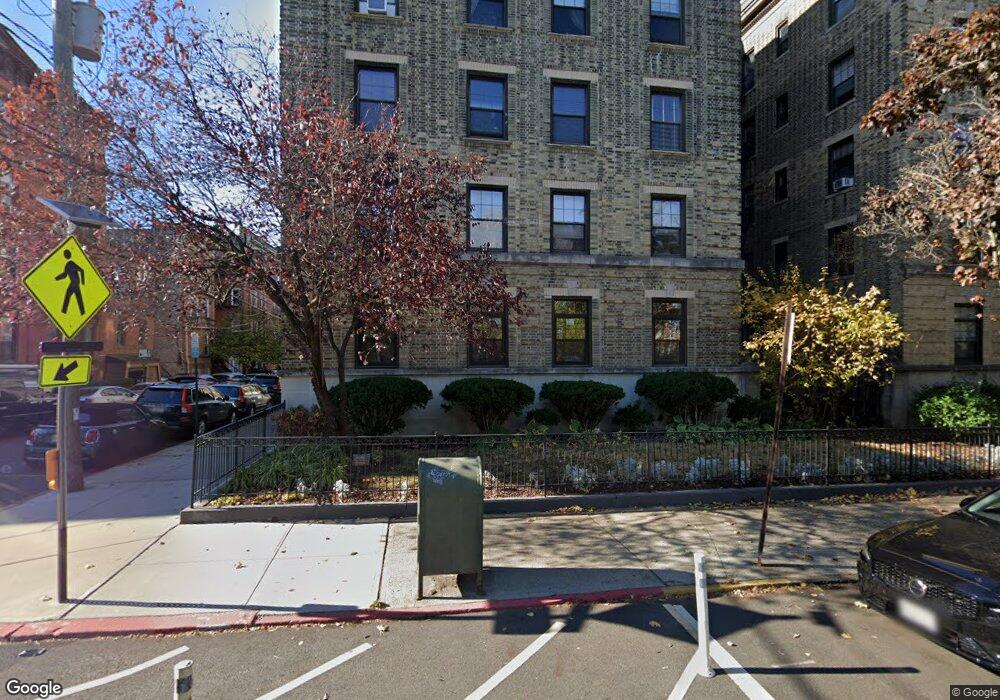
1000 Hudson St, Unit 12 Hoboken, NJ 07030
Estimated Value: $684,434 - $943,000
2
Beds
--
Bath
909
Sq Ft
$943/Sq Ft
Est. Value
About This Home
This home is located at 1000 Hudson St Unit 12, Hoboken, NJ 07030 and is currently estimated at $857,109, approximately $942 per square foot. 1000 Hudson St Unit 12 is a home located in Hudson County with nearby schools including Hoboken High School, Hoboken Charter School, and Elysian Charter School of Hoboken.
Ownership History
Date
Name
Owned For
Owner Type
Purchase Details
Closed on
Jun 15, 2012
Sold by
Sledge Ellen and Sledge Timothy
Bought by
Vulpis Lainie
Current Estimated Value
Home Financials for this Owner
Home Financials are based on the most recent Mortgage that was taken out on this home.
Original Mortgage
$355,000
Outstanding Balance
$254,026
Interest Rate
3.7%
Mortgage Type
New Conventional
Purchase Details
Closed on
Nov 1, 2004
Sold by
Grieco Richard and Grieco Barbara
Bought by
Sledge Timothy and Sledge Ellen
Home Financials for this Owner
Home Financials are based on the most recent Mortgage that was taken out on this home.
Original Mortgage
$333,700
Interest Rate
4.75%
Mortgage Type
Fannie Mae Freddie Mac
Purchase Details
Closed on
Jun 30, 1997
Sold by
Kilgore Richard
Bought by
Grieco Richard
Home Financials for this Owner
Home Financials are based on the most recent Mortgage that was taken out on this home.
Original Mortgage
$120,000
Interest Rate
7.81%
Create a Home Valuation Report for This Property
The Home Valuation Report is an in-depth analysis detailing your home's value as well as a comparison with similar homes in the area
Home Values in the Area
Average Home Value in this Area
Purchase History
| Date | Buyer | Sale Price | Title Company |
|---|---|---|---|
| Vulpis Lainie | $443,750 | None Available | |
| Sledge Timothy | $445,000 | Commonwealth Land Title Insu | |
| Grieco Richard | $171,000 | -- |
Source: Public Records
Mortgage History
| Date | Status | Borrower | Loan Amount |
|---|---|---|---|
| Open | Vulpis Lainie | $355,000 | |
| Previous Owner | Sledge Timothy | $44,500 | |
| Previous Owner | Sledge Timothy | $333,700 | |
| Previous Owner | Grieco Richard | $120,000 |
Source: Public Records
Tax History Compared to Growth
Tax History
| Year | Tax Paid | Tax Assessment Tax Assessment Total Assessment is a certain percentage of the fair market value that is determined by local assessors to be the total taxable value of land and additions on the property. | Land | Improvement |
|---|---|---|---|---|
| 2025 | $8,816 | $499,200 | $249,200 | $250,000 |
| 2024 | $8,132 | $499,200 | $249,200 | $250,000 |
| 2023 | $8,132 | $499,200 | $249,200 | $250,000 |
| 2022 | $7,992 | $499,200 | $249,200 | $250,000 |
| 2021 | $7,987 | $499,200 | $249,200 | $250,000 |
| 2020 | $8,042 | $499,200 | $249,200 | $250,000 |
| 2019 | $7,982 | $499,200 | $249,200 | $250,000 |
| 2018 | $7,887 | $499,200 | $249,200 | $250,000 |
| 2017 | $7,947 | $499,200 | $249,200 | $250,000 |
| 2016 | $7,743 | $499,200 | $249,200 | $250,000 |
| 2015 | $7,473 | $499,200 | $249,200 | $250,000 |
| 2014 | $7,129 | $499,200 | $249,200 | $250,000 |
Source: Public Records
About This Building
Map
Nearby Homes
- 933 Hudson St Unit 6
- 1027 Washington St Unit 4F
- 1000 Maxwell Ln Unit 10J
- 1026 Washington St Unit 2F
- 1029 Bloomfield St
- 1025 Maxwell Ln Unit 906
- 1025 Maxwell Ln Unit 1209
- 914 Washington St
- 940 Bloomfield St Unit 1
- 1100 Maxwell Ln Unit 215
- 1100 Maxwell Ln Unit 238
- 1100 Maxwell Ln Unit 1213
- 1117 Washington St Unit 3
- 103 9th St Unit 4
- 921 Garden St Unit 3
- 1000 Garden St
- 1034 Garden St Unit 1
- 1125 Maxwell Ln Unit 711
- 1125 Maxwell Ln Unit 1021
- 811 Washington St Unit 5R/10
- 1000 Hudson St Unit 12
- 1000 Hudson St Unit 12
- 1000 Hudson St Unit 12
- 1000 Hudson St Unit 12
- 1000 Hudson St Unit 12
- 1000 Hudson St Unit 12
- 1000 Hudson St Unit 12
- 1000 Hudson St Unit 12
- 1000 Hudson St Unit 12
- 1000 Hudson St Unit 12
- 1000 Hudson St Unit 12
- 1000 Hudson St Unit 12
- 1000 Hudson St Unit 12
- 1000 Hudson St Unit 12
- 1000 Hudson St Unit 12
- 1000 Hudson St Unit 12
- 1000 Hudson St Unit 12
- 1000 Hudson St Unit 12
- 1000 Hudson St Unit 12
- 1000 Hudson St Unit 12