1000 Intervale Ave Bronx, NY 10459
Foxhurst NeighborhoodEstimated Value: $765,388 - $1,032,000
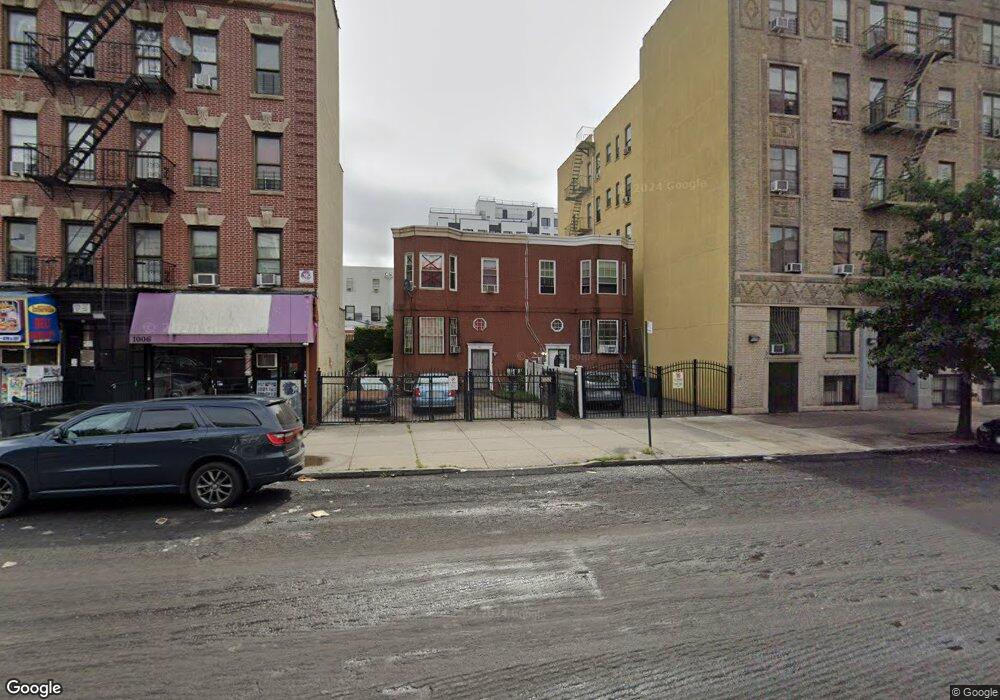
About This Home
This home is located at 1000 Intervale Ave, Bronx, NY 10459 and is currently estimated at $865,097, approximately $514 per square foot. 1000 Intervale Ave is a home located in Bronx County with nearby schools including P.S. 150 - Charles James Fox, P.S. 214, and Pharos Academy Charter School.
Ownership History
We collect this data history from publicly available records. To have your information removed, we recommend requesting removal directly through your county’s website.
Purchase Details
Home Financials for this Owner
Home Financials are based on the most recent Mortgage that was taken out on this home.Purchase Details
Home Financials for this Owner
Home Financials are based on the most recent Mortgage that was taken out on this home.Purchase Details
Home Financials for this Owner
Home Financials are based on the most recent Mortgage that was taken out on this home.Home Values in the Area
Average Home Value in this Area
Purchase History
We collect this data history from publicly available records. To have your information removed, we recommend requesting removal directly through your county’s website.
| Date | Buyer | Sale Price | Title Company |
|---|---|---|---|
| $360,000 | -- | ||
| -- | -- | ||
| $315,000 | -- |
Mortgage History
We collect this data history from publicly available records. To have your information removed, we recommend requesting removal directly through your county’s website.
| Date | Status | Borrower | Loan Amount |
|---|---|---|---|
| Open | $350,874 | ||
| Previous Owner | $401,149 | ||
| Previous Owner | $299,250 |
Tax History
We collect this data history from publicly available records. To have your information removed, we recommend requesting removal directly through your county’s website.
| Year | Tax Paid | Tax Assessment Tax Assessment Total Assessment is a certain percentage of the fair market value that is determined by local assessors to be the total taxable value of land and additions on the property. | Land | Improvement |
|---|---|---|---|---|
| 2026 | $6,465 | $34,214 | $8,630 | $25,584 |
| 2025 | $6,105 | $33,610 | $8,489 | $25,121 |
| 2024 | $6,105 | $31,795 | $8,580 | $23,215 |
| 2023 | $6,173 | $31,795 | $7,378 | $24,417 |
| 2022 | $5,746 | $42,780 | $11,820 | $30,960 |
| 2021 | $5,697 | $35,760 | $11,820 | $23,940 |
| 2020 | $5,632 | $37,740 | $11,820 | $25,920 |
| 2019 | $5,250 | $35,940 | $11,820 | $24,120 |
| 2018 | $5,104 | $26,496 | $10,195 | $16,301 |
| 2017 | $4,834 | $25,185 | $10,904 | $14,281 |
| 2016 | $4,440 | $23,760 | $11,820 | $11,940 |
| 2015 | $2,852 | $23,340 | $9,840 | $13,500 |
| 2014 | $2,852 | $22,080 | $9,840 | $12,240 |
Map
- 918 E 165th St
- 883 E 165th St Unit 3B
- 950 Rev James A Polite Ave
- 924 Rev James A Polite Ave
- 920 Union Ave Unit A
- 896 Union Ave Unit B
- 1137 Tiffany St Unit COMM
- 882 Union Ave Unit B
- 827 E 161st St Unit B
- 950 Hoe Ave Unit 4D
- 880 Home St
- 801 E 161st St
- 1017 Faile St Unit 1017B
- 1124 Fox St
- 823 Fox St Unit 4B
- 863 Home St
- 829 Southern Blvd Unit 3D
- 1012 Faile St Unit 1012A
- 776 Hewitt Place
- 853 Macy Place Unit 4H
- 984 Intervale Ave
- 990 Intervale Ave
- 982 Intervale Ave
- 992 Intervale Ave
- 980 Intervale Ave
- 949-951 Westchester Ave
- 994 Intervale Ave
- 997 Kelly St
- 955-957 Westchester Ave
- 976-978 Intervale Ave
- 999 Kelly St
- 999 Kelly St
- 999 Kelly St Unit A
- 998 Intervale Ave
- 1001 Kelly St
- 995 Kelly St
- 1003 Kelly St
- 947 Westchester Ave
- 1005 Kelly St
- 1006 Intervale Ave
Ask me questions while you tour the home.