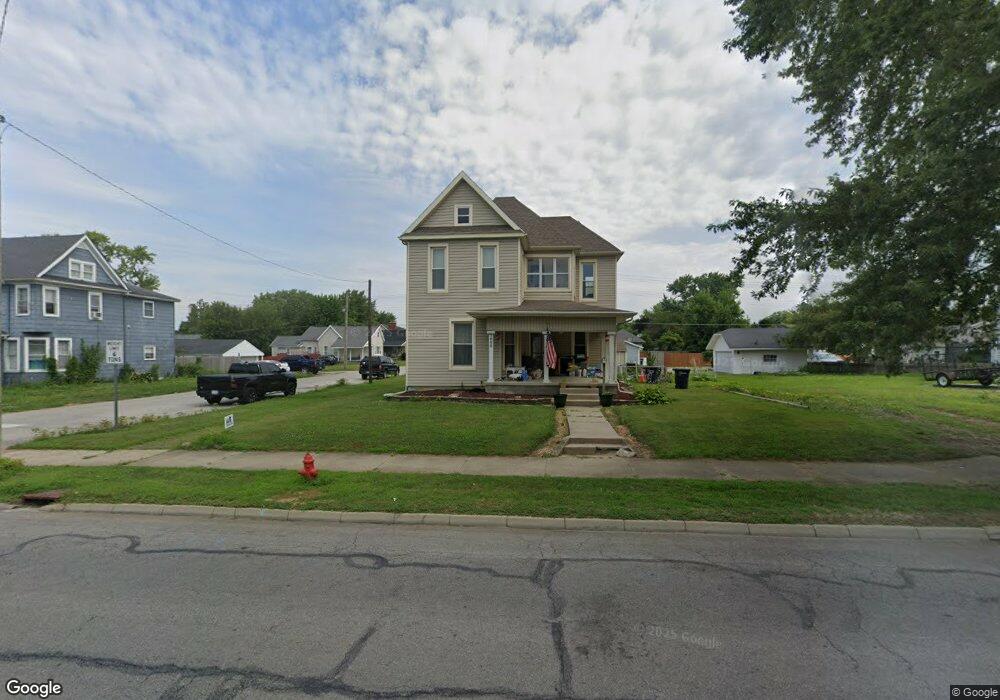
1000 Main St Elwood, IN 46036
Estimated Value: $134,000 - $220,474
3
Beds
2
Baths
3,012
Sq Ft
$60/Sq Ft
Est. Value
About This Home
This home is located at 1000 Main St, Elwood, IN 46036 and is currently estimated at $180,119, approximately $59 per square foot. 1000 Main St is a home located in Madison County with nearby schools including Elwood Elementary School, Elwood Intermediate School, and Elwood Junior-Senior High School.
Ownership History
Date
Name
Owned For
Owner Type
Purchase Details
Closed on
May 12, 2008
Sold by
Us Bank National Assn
Bought by
Anderson Adam D
Current Estimated Value
Home Financials for this Owner
Home Financials are based on the most recent Mortgage that was taken out on this home.
Original Mortgage
$38,800
Interest Rate
5.96%
Mortgage Type
New Conventional
Purchase Details
Closed on
Feb 15, 2008
Sold by
England Johnnie T and England Kathy M
Bought by
Us Bank Na
Create a Home Valuation Report for This Property
The Home Valuation Report is an in-depth analysis detailing your home's value as well as a comparison with similar homes in the area
Home Values in the Area
Average Home Value in this Area
Purchase History
| Date | Buyer | Sale Price | Title Company |
|---|---|---|---|
| Anderson Adam D | -- | -- | |
| Us Bank Na | $53,130 | -- |
Source: Public Records
Mortgage History
| Date | Status | Borrower | Loan Amount |
|---|---|---|---|
| Previous Owner | Anderson Adam D | $38,800 |
Source: Public Records
Tax History Compared to Growth
Tax History
| Year | Tax Paid | Tax Assessment Tax Assessment Total Assessment is a certain percentage of the fair market value that is determined by local assessors to be the total taxable value of land and additions on the property. | Land | Improvement |
|---|---|---|---|---|
| 2025 | $1,951 | $159,000 | $13,400 | $145,600 |
| 2024 | $1,951 | $159,000 | $13,400 | $145,600 |
| 2023 | $1,650 | $144,800 | $12,800 | $132,000 |
| 2022 | $1,726 | $144,000 | $12,000 | $132,000 |
| 2021 | $1,523 | $132,400 | $12,000 | $120,400 |
| 2020 | $1,990 | $134,300 | $11,500 | $122,800 |
| 2019 | $1,938 | $130,800 | $11,500 | $119,300 |
| 2018 | $1,182 | $119,300 | $11,500 | $107,800 |
| 2017 | $1,148 | $117,900 | $11,500 | $106,400 |
| 2016 | $1,205 | $121,100 | $11,500 | $109,600 |
| 2014 | $1,183 | $120,400 | $11,500 | $108,900 |
| 2013 | $1,183 | $120,400 | $11,500 | $108,900 |
Source: Public Records
Map
Nearby Homes