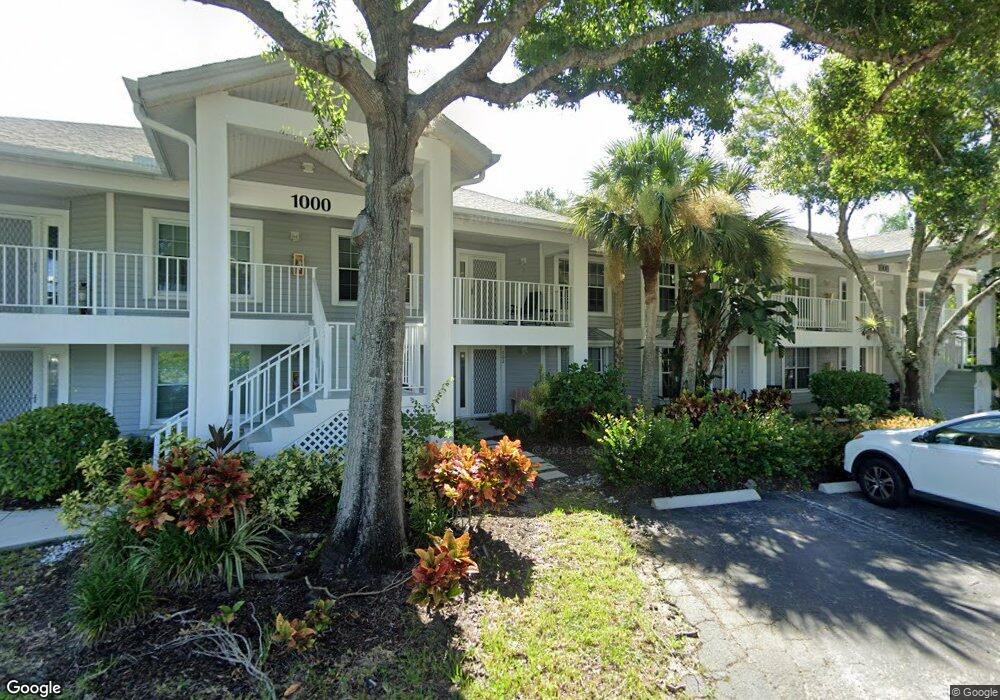
1000 Misty Pines Cir Unit 102 Naples, FL 34105
Moorings Park-Hawks Ridge NeighborhoodEstimated Value: $281,000 - $359,000
3
Beds
2
Baths
1,604
Sq Ft
$204/Sq Ft
Est. Value
About This Home
This home is located at 1000 Misty Pines Cir Unit 102, Naples, FL 34105 and is currently estimated at $327,525, approximately $204 per square foot. 1000 Misty Pines Cir Unit 102 is a home located in Collier County with nearby schools including Osceola Elementary School, Pine Ridge Middle School, and Barron Collier High School.
Ownership History
Date
Name
Owned For
Owner Type
Purchase Details
Closed on
May 16, 2013
Sold by
Gardner Richard T
Bought by
Gardner Tonya A
Current Estimated Value
Purchase Details
Closed on
May 29, 2008
Sold by
Lipman Rick
Bought by
Palermo Tonya Ann
Home Financials for this Owner
Home Financials are based on the most recent Mortgage that was taken out on this home.
Original Mortgage
$170,000
Interest Rate
6%
Mortgage Type
Seller Take Back
Purchase Details
Closed on
Mar 20, 2008
Sold by
Menough Lorri M
Bought by
Lipman Rick
Purchase Details
Closed on
Apr 17, 1998
Sold by
Menough Clark J and Menough Lorri M
Bought by
Menough Lorri M
Purchase Details
Closed on
Jul 30, 1993
Sold by
Faraone Peter L
Bought by
Menough Clark J and Menough Lorri M
Home Financials for this Owner
Home Financials are based on the most recent Mortgage that was taken out on this home.
Original Mortgage
$88,600
Interest Rate
7.39%
Create a Home Valuation Report for This Property
The Home Valuation Report is an in-depth analysis detailing your home's value as well as a comparison with similar homes in the area
Home Values in the Area
Average Home Value in this Area
Purchase History
| Date | Buyer | Sale Price | Title Company |
|---|---|---|---|
| Gardner Tonya A | -- | Attorney | |
| Palermo Tonya Ann | $180,000 | Island Title 5 Star Agency L | |
| Lipman Rick | $180,000 | Island Title 5 Star Agency L | |
| Menough Lorri M | -- | -- | |
| Menough Clark J | $98,500 | -- |
Source: Public Records
Mortgage History
| Date | Status | Borrower | Loan Amount |
|---|---|---|---|
| Closed | Palermo Tonya Ann | $170,000 | |
| Previous Owner | Menough Clark J | $88,600 |
Source: Public Records
Tax History Compared to Growth
Tax History
| Year | Tax Paid | Tax Assessment Tax Assessment Total Assessment is a certain percentage of the fair market value that is determined by local assessors to be the total taxable value of land and additions on the property. | Land | Improvement |
|---|---|---|---|---|
| 2025 | $1,033 | $149,857 | -- | -- |
| 2024 | $1,013 | $145,634 | -- | -- |
| 2023 | $1,013 | $141,392 | $0 | $0 |
| 2022 | $1,035 | $137,274 | $0 | $0 |
| 2021 | $1,042 | $133,276 | $0 | $0 |
| 2020 | $1,017 | $131,436 | $0 | $0 |
| 2019 | $993 | $128,481 | $0 | $0 |
| 2018 | $965 | $126,085 | $0 | $0 |
| 2017 | $946 | $123,492 | $0 | $0 |
| 2016 | $921 | $120,952 | $0 | $0 |
| 2015 | $930 | $120,111 | $0 | $0 |
| 2014 | $931 | $69,158 | $0 | $0 |
Source: Public Records
Map
Nearby Homes
- 900 Misty Pines Cir Unit 203
- 800 Misty Pines Cir Unit 205
- 325 Imperial Wilder Blvd
- 117 Bobolink Way Unit 17A
- 208 Bobolink Way Unit 208B
- 2140 Harlans Run
- 2127 Harlans Run
- 2305 Harrier Run
- 1096 Woodshire Ln Unit 202
- 1096 Woodshire Ln Unit 205
- 15 Bobolink Ct Unit !5B
- 15 Bobolink Ct Unit 15B
- 15 Bobolink Ct Unit 15A
- 3343 Timberwood Cir
- 1940 Bald Eagle Dr
- 3408 Timberwood Cir Unit 136-0
- 3412 Timberwood Cir
- 18 Bobolink Ct Unit 18B
- 992 Woodshire Ln Unit 205
- 992 Woodshire Ln Unit 301
- 1000 Misty Pines Cir Unit 204
- 1000 Misty Pines Cir Unit 203
- 1000 Misty Pines Cir Unit 104
- 1000 Misty Pines Cir Unit 101
- 1000 Misty Pines Cir Unit 103
- 1000 Misty Pines Cir Unit 201
- 1000 Misty Pines Cir Unit 202
- 2401 Pinewoods Cir Unit 14
- 900 Misty Pines Cir Unit 204
- 900 Misty Pines Cir Unit 202
- 900 Misty Pines Cir Unit B
- 900 Misty Pines Cir Unit 102
- 900 Misty Pines Cir Unit 2D
- 900 Misty Pines Cir Unit 2C
- 900 Misty Pines Cir Unit 2B
- 900 Misty Pines Cir Unit 2A
- 900 Misty Pines Cir Unit 1B
- 900 Misty Pines Cir Unit 1A
- 900 Misty Pines Cir Unit 101
- 2407 Pinewoods Cir Unit 13