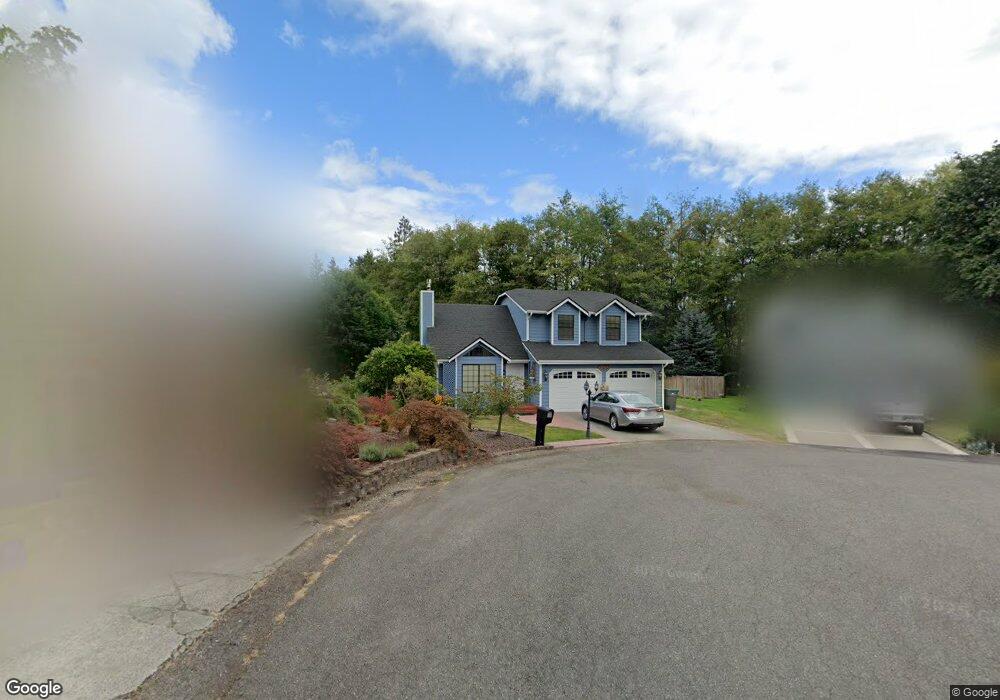
1000 NE Knights Ct Bremerton, WA 98311
Estimated Value: $517,000 - $578,000
3
Beds
3
Baths
1,212
Sq Ft
$453/Sq Ft
Est. Value
About This Home
This home is located at 1000 NE Knights Ct, Bremerton, WA 98311 and is currently estimated at $549,328, approximately $453 per square foot. 1000 NE Knights Ct is a home located in Kitsap County with nearby schools including Woodlands Elementary School, Fairview Middle School, and Olympic High School.
Ownership History
Date
Name
Owned For
Owner Type
Purchase Details
Closed on
Aug 2, 2004
Sold by
Webb Richard F and Webb Christine L
Bought by
Burleigh Daniel and Burleigh Suzanne H
Current Estimated Value
Home Financials for this Owner
Home Financials are based on the most recent Mortgage that was taken out on this home.
Original Mortgage
$244,769
Outstanding Balance
$116,271
Interest Rate
5.37%
Mortgage Type
VA
Estimated Equity
$433,057
Purchase Details
Closed on
Jun 13, 1995
Sold by
Neubauer John C and Wren Neubauer Anna L
Bought by
Webb Richard F and Webb Christine L
Home Financials for this Owner
Home Financials are based on the most recent Mortgage that was taken out on this home.
Original Mortgage
$138,020
Interest Rate
8.37%
Mortgage Type
Assumption
Create a Home Valuation Report for This Property
The Home Valuation Report is an in-depth analysis detailing your home's value as well as a comparison with similar homes in the area
Home Values in the Area
Average Home Value in this Area
Purchase History
| Date | Buyer | Sale Price | Title Company |
|---|---|---|---|
| Burleigh Daniel | $239,500 | Pacific Nw Title | |
| Webb Richard F | $134,000 | Charter Title Corp |
Source: Public Records
Mortgage History
| Date | Status | Borrower | Loan Amount |
|---|---|---|---|
| Open | Burleigh Daniel | $244,769 | |
| Previous Owner | Webb Richard F | $138,020 |
Source: Public Records
Tax History Compared to Growth
Tax History
| Year | Tax Paid | Tax Assessment Tax Assessment Total Assessment is a certain percentage of the fair market value that is determined by local assessors to be the total taxable value of land and additions on the property. | Land | Improvement |
|---|---|---|---|---|
| 2026 | $4,672 | $495,300 | $104,390 | $390,910 |
| 2025 | $4,672 | $495,300 | $104,390 | $390,910 |
| 2024 | $4,545 | $495,300 | $104,390 | $390,910 |
| 2023 | $4,561 | $495,300 | $104,390 | $390,910 |
| 2022 | $4,295 | $410,640 | $86,270 | $324,370 |
| 2021 | $3,941 | $357,870 | $63,720 | $294,150 |
| 2020 | $3,681 | $338,120 | $60,130 | $277,990 |
| 2019 | $3,432 | $304,800 | $54,290 | $250,510 |
| 2018 | $3,676 | $253,360 | $44,870 | $208,490 |
| 2017 | $3,267 | $253,360 | $44,870 | $208,490 |
| 2015 | $2,767 | $206,400 | $44,380 | $162,020 |
| 2014 | -- | $196,710 | $44,380 | $152,330 |
| 2013 | -- | $196,710 | $44,380 | $152,330 |
Source: Public Records
Map
Nearby Homes
- 7545 Old Military Rd NE
- 7529 Bridge Place NE
- 7701 Beacon Place NE Unit B103
- 7761 Beacon Place NE Unit G-107
- 7761 Beacon Place NE Unit 103
- 960 NE Marwood Dr
- 3924 McCormick Village Dr
- 7655 Forest Ridge Dr NE
- 250 NE Silver Pine Dr
- 6748 Scorpio Ln NE
- 404 NE Saturn Ln
- 0 Kaster Dr NE
- 425 NE Saturn Ln
- 7020 Saint Charles Ln NE
- 940 Yoder Ln NE
- 7237 Harvard Ct NW
- 6522 State Hwy 303 NE
- 6630 NE Aquarius Ln
- 8537 Washington 303
- 8065 Autumn Hills Place NE
- 7497 Woodbridge Ln NW
- 7505 Bridge Place NE
- 5 LOTS Morning View Ave NE
- 0 xxx NE Canoe Trail
- 0 Lot 10 Maple Ave
- 1001 NE Knights Ct
- 1005 NE Knights Ct
- 1010 NE Knights Ct
- 7509 Bridge Place NE
- 1009 NE Knights Ct
- 1014 NE Knights Ct
- 7514 Bridge Place NE
- 1013 NE Knights Ct
- 7410 Old Military Rd NE Unit 73
- 7410 Old Military Rd NE Unit 48
- 7410 Old Military Rd NE Unit 1A
- 7410 Old Military Rd NE Unit 42
- 7410 Old Military Rd NE Unit 35
- 7410 Old Military Rd NE
- 7410 Old Military Rd NE Unit 68