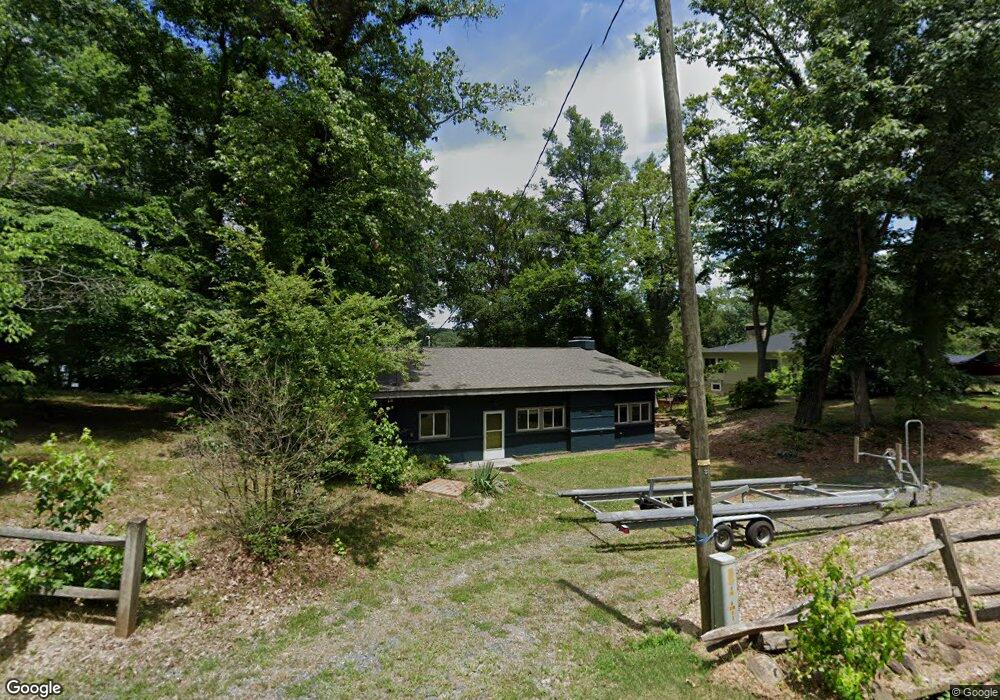
1000 Pinehaven Dr Unit 164 New London, NC 28127
Estimated Value: $623,000 - $739,000
1
Bed
2
Baths
1,796
Sq Ft
$376/Sq Ft
Est. Value
About This Home
This home is located at 1000 Pinehaven Dr Unit 164, New London, NC 28127 and is currently estimated at $674,427, approximately $375 per square foot. 1000 Pinehaven Dr Unit 164 is a home located in Montgomery County with nearby schools including Troy Elementary School, Page Street Elementary School, and West Middle School.
Ownership History
Date
Name
Owned For
Owner Type
Purchase Details
Closed on
May 18, 2023
Sold by
Sargent James M
Bought by
Kumaraswamy Lalith and Lalithkumar Tharmareqa
Current Estimated Value
Home Financials for this Owner
Home Financials are based on the most recent Mortgage that was taken out on this home.
Original Mortgage
$392,600
Outstanding Balance
$381,463
Interest Rate
6.28%
Mortgage Type
New Conventional
Estimated Equity
$292,964
Purchase Details
Closed on
Mar 9, 2023
Sold by
Sargent James M and Sargent Paula J
Bought by
Sargent James M
Purchase Details
Closed on
Apr 8, 2015
Sold by
Draudt Karen Shiels and Draudt David D
Bought by
Sargent James M and Sargent Paula J
Purchase Details
Closed on
Oct 1, 1996
Bought by
Draudt Karen Shields
Create a Home Valuation Report for This Property
The Home Valuation Report is an in-depth analysis detailing your home's value as well as a comparison with similar homes in the area
Home Values in the Area
Average Home Value in this Area
Purchase History
| Date | Buyer | Sale Price | Title Company |
|---|---|---|---|
| Kumaraswamy Lalith | $491,000 | None Listed On Document | |
| Sargent James M | -- | -- | |
| Sargent James M | $250,000 | None Available | |
| Draudt Karen Shields | -- | -- |
Source: Public Records
Mortgage History
| Date | Status | Borrower | Loan Amount |
|---|---|---|---|
| Open | Kumaraswamy Lalith | $392,600 |
Source: Public Records
Tax History Compared to Growth
Tax History
| Year | Tax Paid | Tax Assessment Tax Assessment Total Assessment is a certain percentage of the fair market value that is determined by local assessors to be the total taxable value of land and additions on the property. | Land | Improvement |
|---|---|---|---|---|
| 2025 | $2,626 | $383,369 | $224,000 | $159,369 |
| 2024 | $2,626 | $383,369 | $224,000 | $159,369 |
| 2023 | $2,626 | $383,369 | $224,000 | $159,369 |
| 2022 | $2,626 | $383,369 | $224,000 | $159,369 |
| 2021 | $2,569 | $383,369 | $224,000 | $159,369 |
| 2020 | $2,553 | $381,059 | $224,000 | $157,059 |
| 2018 | $2,750 | $407,369 | $234,500 | $172,869 |
| 2017 | $2,750 | $407,369 | $234,500 | $172,869 |
| 2016 | $2,750 | $407,369 | $234,500 | $172,869 |
| 2015 | $2,249 | $355,500 | $0 | $0 |
| 2014 | $2,249 | $355,464 | $0 | $0 |
Source: Public Records
Map
Nearby Homes
- 187 8th Ave
- 196 8th Ave
- 150 8th Ave
- 1135 Pinehaven Dr
- 113 Red Budd Dr
- 116 3rd Ave
- 378 Shoreline Dr
- 319 Shoreline Dr
- 286 Aberdeen Ct E Unit 43
- 0 Lakeshore Dr Unit 258 CAR4287999
- 102 Archer Glen Unit 27
- 126 Strand Dr
- 110 Watch Harbor Rd
- 202 Patterson's Bridge None
- 202 Pattersons Bridge
- 122 Patterson's Bridge
- 154 Pattersons Bridge
- 154 Patterson's Bridge
- 154 Patterson's Bridge None
- 137 Heron Bay Dr
- 1000 Pinehaven Dr
- 990 Pinehaven Dr
- 1014 Pinehaven Dr
- 1018 Pinehaven Dr
- 1018 Pinehaven Dr
- 130 Tempelton Rd
- 978 Pinehaven Dr
- 978 Pinehaven Dr Unit 159/160
- 1021 Pinehaven Dr
- 197 7th Ave
- 121 Tempelton Rd
- 1032 Pinehaven Dr
- 974 Pinehaven Dr
- 1034 Pinehaven Dr
- 0 Concord Rd
- n/a Concord Rd
- 192 7th Ave
- 103 Tempelton Rd
- 0 6th Ave Unit 819 3226134
- 0 8th Ave Unit 756 3403446