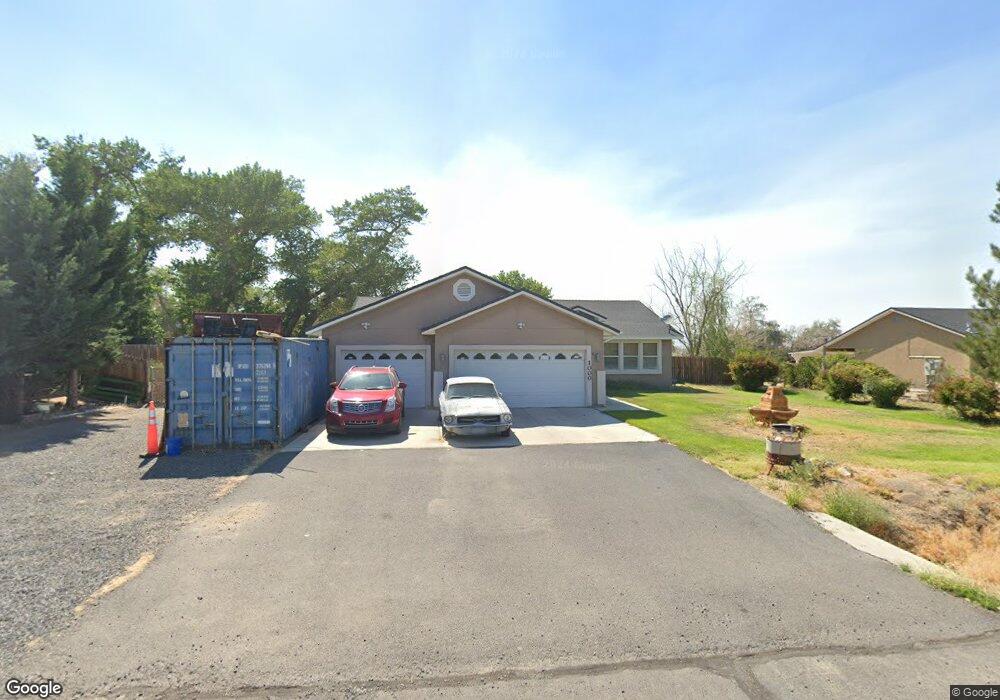
1000 Red Rock Rd Fernley, NV 89408
Estimated Value: $469,000 - $565,000
3
Beds
2
Baths
1,854
Sq Ft
$276/Sq Ft
Est. Value
About This Home
This home is located at 1000 Red Rock Rd, Fernley, NV 89408 and is currently estimated at $512,199, approximately $276 per square foot. 1000 Red Rock Rd is a home located in Lyon County with nearby schools including East Valley Elementary School, Fernley Intermediate School, and Fernley High School.
Ownership History
Date
Name
Owned For
Owner Type
Purchase Details
Closed on
Oct 30, 2009
Sold by
Balzer John R and Balzer Barbara A
Bought by
Lofton Jeffrey A and Lofton La Rae
Current Estimated Value
Home Financials for this Owner
Home Financials are based on the most recent Mortgage that was taken out on this home.
Original Mortgage
$325,000
Outstanding Balance
$211,342
Interest Rate
4.92%
Mortgage Type
Purchase Money Mortgage
Estimated Equity
$300,857
Purchase Details
Closed on
May 2, 2005
Sold by
Frunk Dennis and Frunk Virginia
Bought by
Balzer John R and Balzer Barbara A
Home Financials for this Owner
Home Financials are based on the most recent Mortgage that was taken out on this home.
Original Mortgage
$178,800
Interest Rate
4.87%
Mortgage Type
New Conventional
Purchase Details
Closed on
Mar 18, 2005
Sold by
C A L Investment Properties
Bought by
Frunk Dennis and Frunk Virginia
Home Financials for this Owner
Home Financials are based on the most recent Mortgage that was taken out on this home.
Original Mortgage
$178,800
Interest Rate
4.87%
Mortgage Type
New Conventional
Create a Home Valuation Report for This Property
The Home Valuation Report is an in-depth analysis detailing your home's value as well as a comparison with similar homes in the area
Home Values in the Area
Average Home Value in this Area
Purchase History
| Date | Buyer | Sale Price | Title Company |
|---|---|---|---|
| Lofton Jeffrey A | $325,000 | Western Title Company Llc | |
| Balzer John R | $320,000 | Western Title Company Inc | |
| Frunk Dennis | $223,525 | Western Title Company Inc |
Source: Public Records
Mortgage History
| Date | Status | Borrower | Loan Amount |
|---|---|---|---|
| Open | Lofton Jeffrey A | $325,000 | |
| Previous Owner | Frunk Dennis | $178,800 |
Source: Public Records
Tax History Compared to Growth
Tax History
| Year | Tax Paid | Tax Assessment Tax Assessment Total Assessment is a certain percentage of the fair market value that is determined by local assessors to be the total taxable value of land and additions on the property. | Land | Improvement |
|---|---|---|---|---|
| 2025 | $2,383 | $137,833 | $47,250 | $90,583 |
| 2024 | $2,723 | $127,788 | $36,750 | $91,038 |
| 2023 | $2,723 | $122,039 | $36,750 | $85,289 |
| 2022 | $2,558 | $114,644 | $36,750 | $77,894 |
| 2021 | $2,520 | $112,727 | $36,750 | $75,977 |
| 2020 | $2,454 | $110,223 | $36,750 | $73,473 |
| 2019 | $2,411 | $104,155 | $33,250 | $70,905 |
| 2018 | $2,356 | $93,614 | $24,500 | $69,114 |
| 2017 | $2,332 | $81,225 | $12,250 | $68,975 |
| 2016 | $2,128 | $57,973 | $7,880 | $50,093 |
| 2015 | $2,162 | $50,461 | $7,880 | $42,581 |
| 2014 | $2,110 | $47,367 | $7,880 | $39,487 |
Source: Public Records
Map
Nearby Homes
- 3175 Quick Cal Way
- 1477 Green River Ln
- 2976 N Fork Rd
- 141 Country Ranch Rd
- 1428 Walker River Way
- 1357 Horse Creek Way
- 1434 Walker River Way
- 6778 Shell Ct
- 1063 Pepper Ln Unit 192
- 3299 Hadley St Unit Lot 62
- 1315 Rouge River Rd
- 3457 Payton Way
- 3466 Payton Way
- 3462 Payton Way Unit Lot 98
- 3274 Eleanor Way
- 751 Divot Dr
- 763 Divot Dr
- 7785 Desert Shadows Ln
- 770 Divot Dr
- 777 Divot Dr
- 1020 Red Rock Rd
- 980 Red Rock Rd
- 1021 Red Rock Rd
- 3192 Deadeye Kid Ct
- 1040 Red Rock Rd
- 960 Red Rock Rd
- 941 Red Rock Rd
- 3193 Deadeye Kid Ct
- 3194 Deadeye Kid Ct
- 1060 Red Rock Rd
- 940 Red Rock Rd
- 1041 Red Rock Rd
- 1080 Red Rock Rd
- 3177 Colt Ct
- 1061 Red Rock Rd
- 3196 Quick Cal Way
- 3179 Colt Ct
- 901 Red Rock Rd
- 3176 Colt Ct
- 3178 Colt Ct