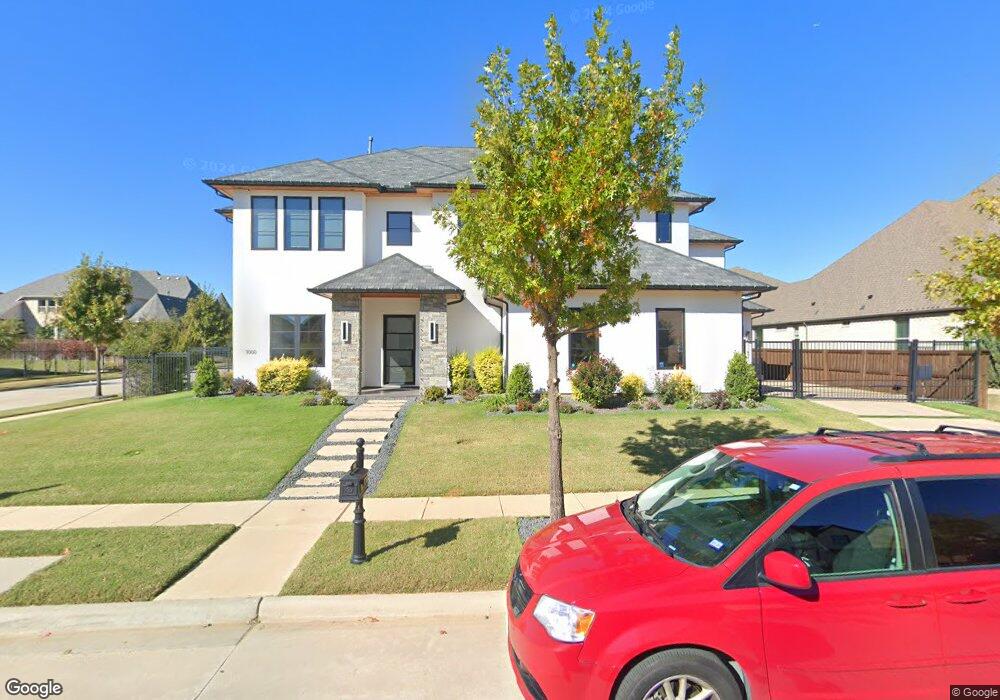
1000 Rhone Ln Southlake, TX 76092
Estimated Value: $2,045,467 - $2,140,000
--
Bed
--
Bath
5,107
Sq Ft
$411/Sq Ft
Est. Value
About This Home
This home is located at 1000 Rhone Ln, Southlake, TX 76092 and is currently estimated at $2,101,156, approximately $411 per square foot. 1000 Rhone Ln is a home with nearby schools including Jack D. Johnson Elementary, Don T. Durham Intermediate School, and Carroll Middle School.
Ownership History
Date
Name
Owned For
Owner Type
Purchase Details
Closed on
Oct 25, 2019
Sold by
Kansagra Amol Keshavlal and Mehta Shailini P
Bought by
Kansagra Amol Keshavlal and Mehta Shailini P
Current Estimated Value
Purchase Details
Closed on
May 27, 2016
Sold by
Calais Custom Homes Llc
Bought by
Mehta Shailini and Kansagra Amol
Home Financials for this Owner
Home Financials are based on the most recent Mortgage that was taken out on this home.
Original Mortgage
$199,500
Interest Rate
3.59%
Mortgage Type
Purchase Money Mortgage
Purchase Details
Closed on
May 26, 2016
Sold by
Hines Gtis Carillon Llc
Bought by
Calais Custom Homes Llc
Home Financials for this Owner
Home Financials are based on the most recent Mortgage that was taken out on this home.
Original Mortgage
$199,500
Interest Rate
3.59%
Mortgage Type
Purchase Money Mortgage
Create a Home Valuation Report for This Property
The Home Valuation Report is an in-depth analysis detailing your home's value as well as a comparison with similar homes in the area
Home Values in the Area
Average Home Value in this Area
Purchase History
| Date | Buyer | Sale Price | Title Company |
|---|---|---|---|
| Kansagra Amol Keshavlal | -- | None Available | |
| Mehta Shailini | -- | Attorney | |
| Calais Custom Homes Llc | -- | None Available |
Source: Public Records
Mortgage History
| Date | Status | Borrower | Loan Amount |
|---|---|---|---|
| Previous Owner | Mehta Shailini | $199,500 |
Source: Public Records
Tax History Compared to Growth
Tax History
| Year | Tax Paid | Tax Assessment Tax Assessment Total Assessment is a certain percentage of the fair market value that is determined by local assessors to be the total taxable value of land and additions on the property. | Land | Improvement |
|---|---|---|---|---|
| 2025 | $24,407 | $1,471,822 | $400,000 | $1,071,822 |
| 2024 | $24,407 | $1,773,280 | $400,000 | $1,373,280 |
| 2023 | $26,945 | $1,881,931 | $400,000 | $1,481,931 |
| 2022 | $28,994 | $1,592,924 | $250,000 | $1,342,924 |
| 2021 | $30,196 | $1,449,845 | $250,000 | $1,199,845 |
| 2020 | $27,675 | $1,204,000 | $250,000 | $954,000 |
| 2019 | $29,155 | $1,204,000 | $250,000 | $954,000 |
| 2018 | $7,265 | $300,000 | $200,000 | $100,000 |
| 2017 | $4,957 | $200,000 | $200,000 | $0 |
| 2016 | $3,668 | $148,000 | $148,000 | $0 |
| 2015 | -- | $0 | $0 | $0 |
Source: Public Records
Map
Nearby Homes
- 424 Saint Tropez Dr
- 1013 Winfield Ct
- 1816 Riviera Ln
- 1812 Riviera Ln
- 1836 Riviera Ln
- 1820 Riviera Ln
- 1828 Riviera Ln
- 1829 Cannes Cir
- 1821 Cannes Cir
- 225 Murano Place
- 212 Saint Tropez Dr
- 101 Murano Place
- 137 Murano Place
- 172 Murano Place
- 205 Murano Place
- 200 Murano Place
- 217 Murano Place
- 125 Murano Place
- 213 La Rambla Ct
- 208 Saint Tropez Dr