Estimated Value: $163,000 - $196,000
2
Beds
2
Baths
968
Sq Ft
$193/Sq Ft
Est. Value
About This Home
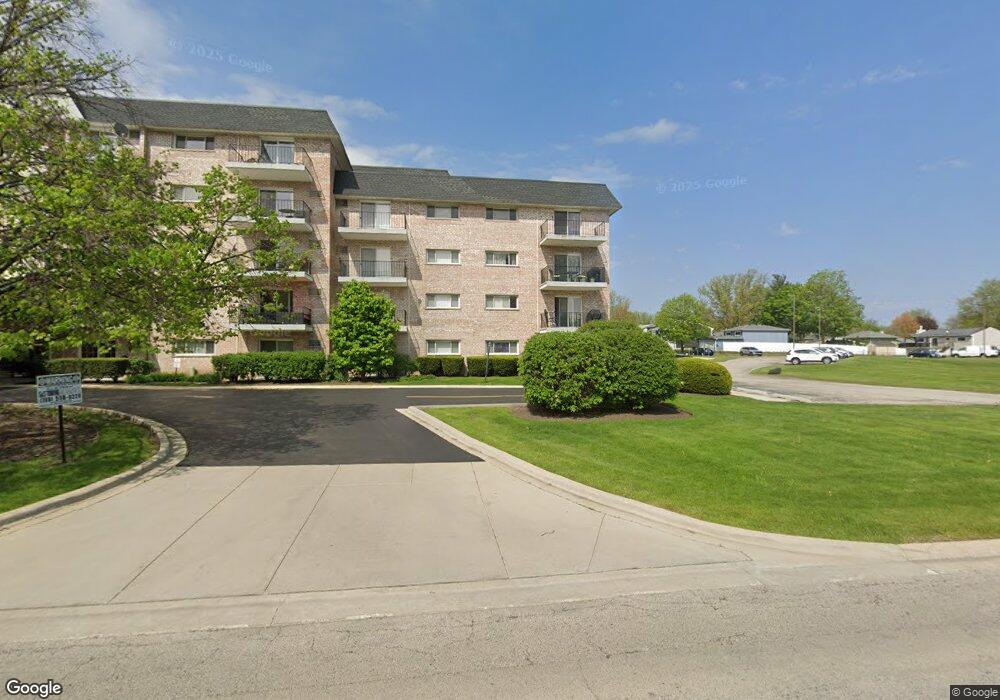
This home is located at 1000 S Lorraine Rd Unit 108, Wheaton, IL 60189 and is currently estimated at $186,882, approximately $193 per square foot. 1000 S Lorraine Rd Unit 108 is a home located in DuPage County with nearby schools including Lincoln Elementary School, Edison Middle School, and Wheaton Warrenville South High School.
Ownership History
Date
Name
Owned For
Owner Type
Purchase Details
Closed on
May 16, 2020
Sold by
Wiseman Pauline
Bought by
Wiseman Pauline and Wiseman Rex G
Current Estimated Value
Purchase Details
Closed on
Mar 30, 2011
Sold by
Fv-1 Inc
Bought by
Wiseman Pauline S
Purchase Details
Closed on
Aug 9, 2010
Sold by
Chmura Kevin A
Bought by
Fv-1 Inc and Morgan Stanley Mortgage Capital Holdings
Purchase Details
Closed on
Mar 16, 2007
Sold by
Chmura Nicole and Jensen Gordon
Bought by
Chmura Kevin A and Chmura Nicole M
Purchase Details
Closed on
Nov 12, 2004
Sold by
1000 South Lorraine Llc
Bought by
Jensen Nicole and Jensen Gordon
Home Financials for this Owner
Home Financials are based on the most recent Mortgage that was taken out on this home.
Original Mortgage
$149,900
Interest Rate
5.25%
Mortgage Type
Purchase Money Mortgage
Create a Home Valuation Report for This Property
The Home Valuation Report is an in-depth analysis detailing your home's value as well as a comparison with similar homes in the area
Home Values in the Area
Average Home Value in this Area
Purchase History
| Date | Buyer | Sale Price | Title Company |
|---|---|---|---|
| Wiseman Pauline | -- | Attorney | |
| Wiseman Pauline S | $72,000 | None Available | |
| Fv-1 Inc | -- | None Available | |
| Chmura Kevin A | -- | K & M Title Co | |
| Jensen Nicole | $150,000 | Ctic |
Source: Public Records
Mortgage History
| Date | Status | Borrower | Loan Amount |
|---|---|---|---|
| Previous Owner | Jensen Nicole | $149,900 |
Source: Public Records
Tax History
| Year | Tax Paid | Tax Assessment Tax Assessment Total Assessment is a certain percentage of the fair market value that is determined by local assessors to be the total taxable value of land and additions on the property. | Land | Improvement |
|---|---|---|---|---|
| 2024 | $958 | $49,899 | $6,497 | $43,402 |
| 2023 | $1,005 | $45,930 | $5,980 | $39,950 |
| 2022 | $2,409 | $45,780 | $5,650 | $40,130 |
| 2021 | $1,406 | $44,700 | $5,520 | $39,180 |
| 2020 | $1,416 | $44,280 | $5,470 | $38,810 |
| 2019 | $1,423 | $43,120 | $5,330 | $37,790 |
| 2018 | $1,940 | $37,780 | $4,670 | $33,110 |
| 2017 | $1,685 | $33,700 | $4,170 | $29,530 |
| 2016 | $1,519 | $32,350 | $4,000 | $28,350 |
| 2015 | $1,584 | $30,870 | $3,820 | $27,050 |
| 2014 | $2,491 | $41,720 | $3,790 | $37,930 |
| 2013 | $2,429 | $41,840 | $3,800 | $38,040 |
Source: Public Records
About This Building
Map
Nearby Homes
- 1000 S Lorraine Rd Unit 214
- 1344 S Lorraine Rd Unit C
- 1216 E Elm St
- 1601 Castbourne Ct
- 502 S Summit St
- 1019 Pershing Ave
- 1581 Groton Ln
- 213 S Summit St
- 1678 Groton Ct
- 510 S President St
- 1026 Briarcliffe Blvd
- 840 Sheldon Ct Unit B
- 185 N Ott Ave
- 1129 Rhodes Ct
- 429 Sandhurst Cir Unit 1
- 121 S Parkside Ave
- 1315 Underwood Terrace
- 450 Raintree Ct Unit 2M
- 450 Raintree Ct Unit 2B
- 478 Raintree Ct Unit 2B
- 1000 S Lorraine Rd Unit 306
- 1000 S Lorraine Rd Unit 301
- 1000 S Lorraine Rd Unit 509
- 1000 S Lorraine Rd Unit 305
- 1000 S Lorraine Rd Unit 102
- 1000 S Lorraine Rd Unit 109
- 1000 S Lorraine Rd Unit 411
- 1000 S Lorraine Rd Unit 103
- 1000 S Lorraine Rd Unit 415
- 1000 S Lorraine Rd Unit 302
- 1000 S Lorraine Rd Unit 101
- 1000 S Lorraine Rd Unit 312
- 1000 S Lorraine Rd Unit 505
- 1000 S Lorraine Rd Unit 213
- 1000 S Lorraine Rd Unit 506
- 1000 S Lorraine Rd Unit 106
- 1000 S Lorraine Rd Unit 208
- 1000 S Lorraine Rd Unit 202
- 1000 S Lorraine Rd Unit 105
- 1000 S Lorraine Rd Unit 507
Your Personal Tour Guide
Ask me questions while you tour the home.